

BAVIS web-based SCADA and data acquisition
BAVIS is our custom web-based SCADA. We build process visualisation and control as a web application running on an industrial PC or server. It is operated from a browser on a PC, tablet or phone, stores data from PLCs and other devices in a database and evaluates it right away. No per-client licences and nothing to install for users.
All applications are built on the shared BAVIS core. For a specific plant we add a project on top of it with its own screens, calculations and reports – for example a test chamber application.
From one house. To a multi-site plant.
From a pumping station to a whole plant with several sites: the same screens, alarms, trends and energy in the browser, on a tablet and on a phone.
Try BAVIS in your browser
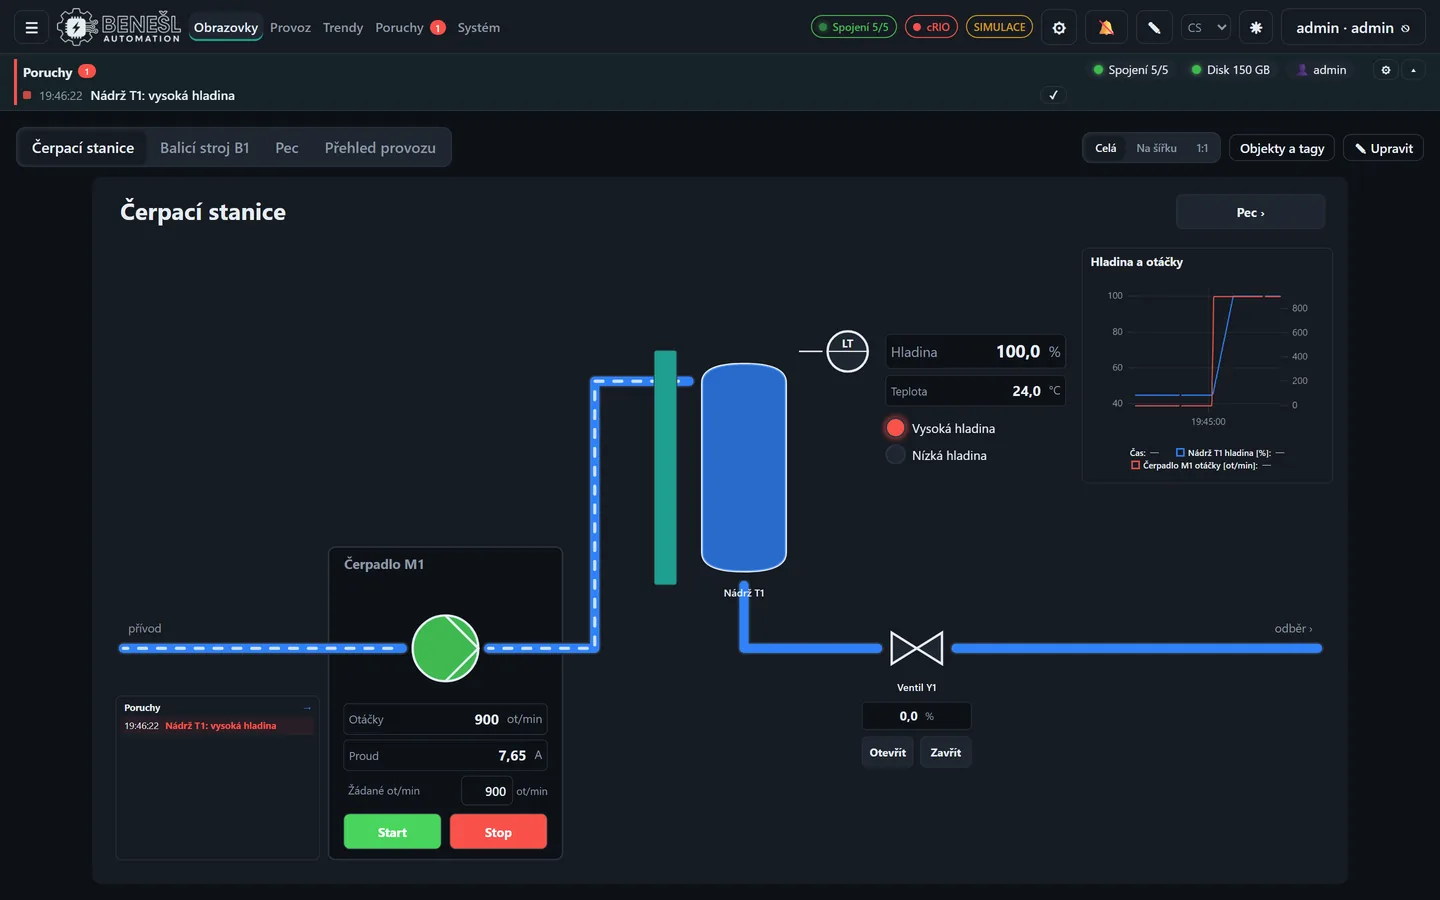
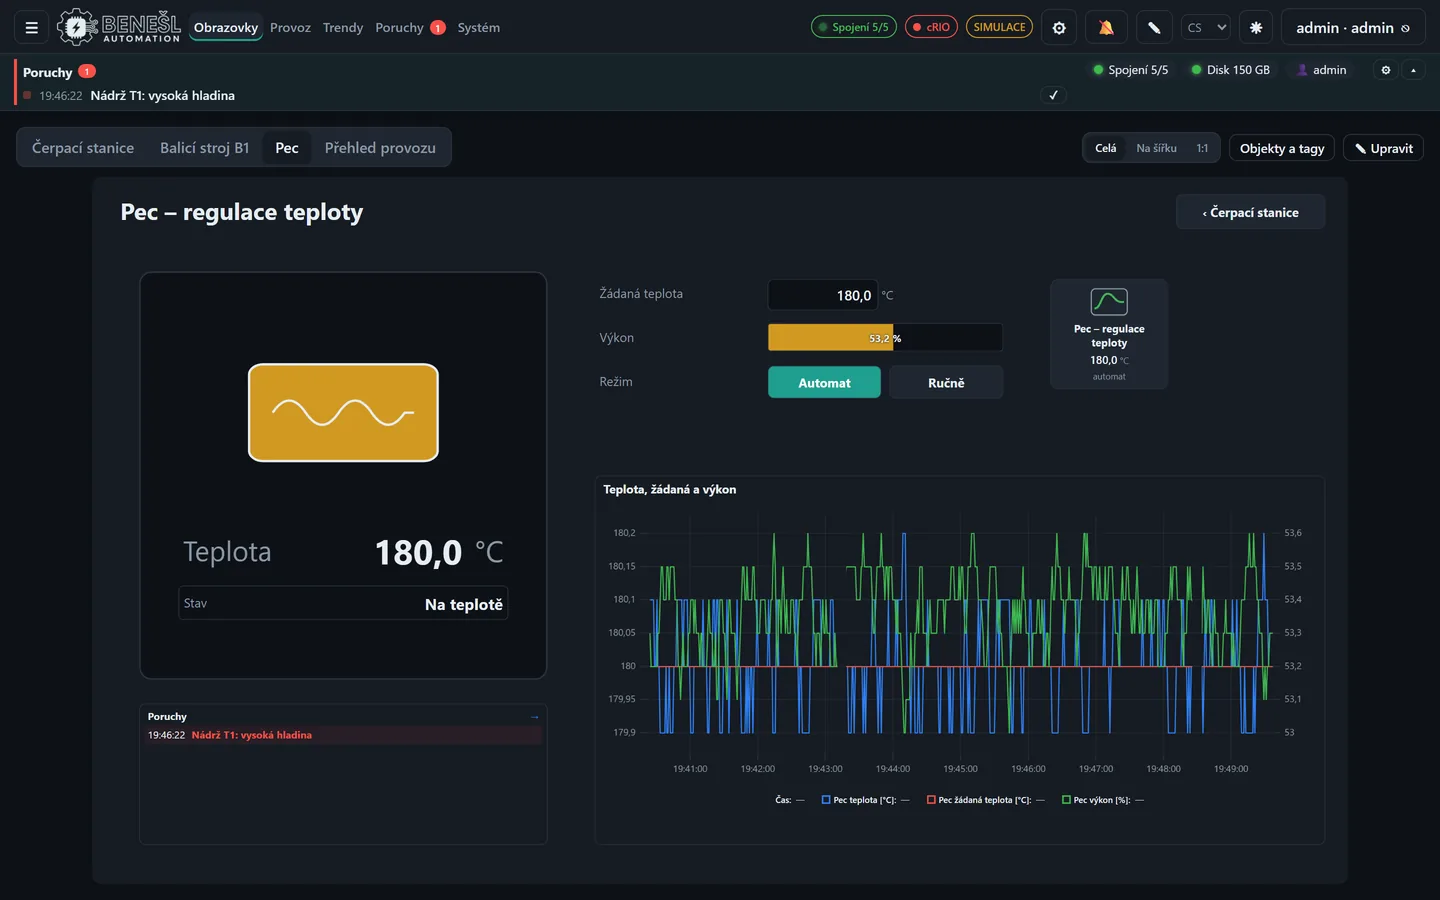
The real BAVIS 3.0 interface on top of a simulated plant: a pumping station, a furnace with temperature control and a packaging machine. Log in, operate the equipment, acknowledge alarms, browse trends and dashboards, plan maintenance and change settings and the project – or create a new project from a template and watch it run in simulation straight away.
The demo runs entirely in your browser. Nothing is sent anywhere and nothing is kept. When you close the tab, after 60 minutes or with the “Reset demo” button, everything returns to its default state. Log in from the demo panel at the bottom right; the accounts are: admin / admin · operator / operator · viewer / viewer · jana / jana
Open the demo full screen Tip: stop the pump or close the valve and watch the level alarm. As administrator you can add a tag and an alarm in Configuration – the change takes effect immediately.
What to try in the demo
- Dashboards: two ready-made shared dashboards (shift and energy); build more from widgets yourself.
- Instrument calibration and maintenance: calibration due dates, work orders, service intervals and spare parts (menu Operation → Maintenance).
- A new project from an industry template (wastewater treatment plant, waterworks, boiler room, HVAC / BMS, production line with OEE) – running in simulation straight away.
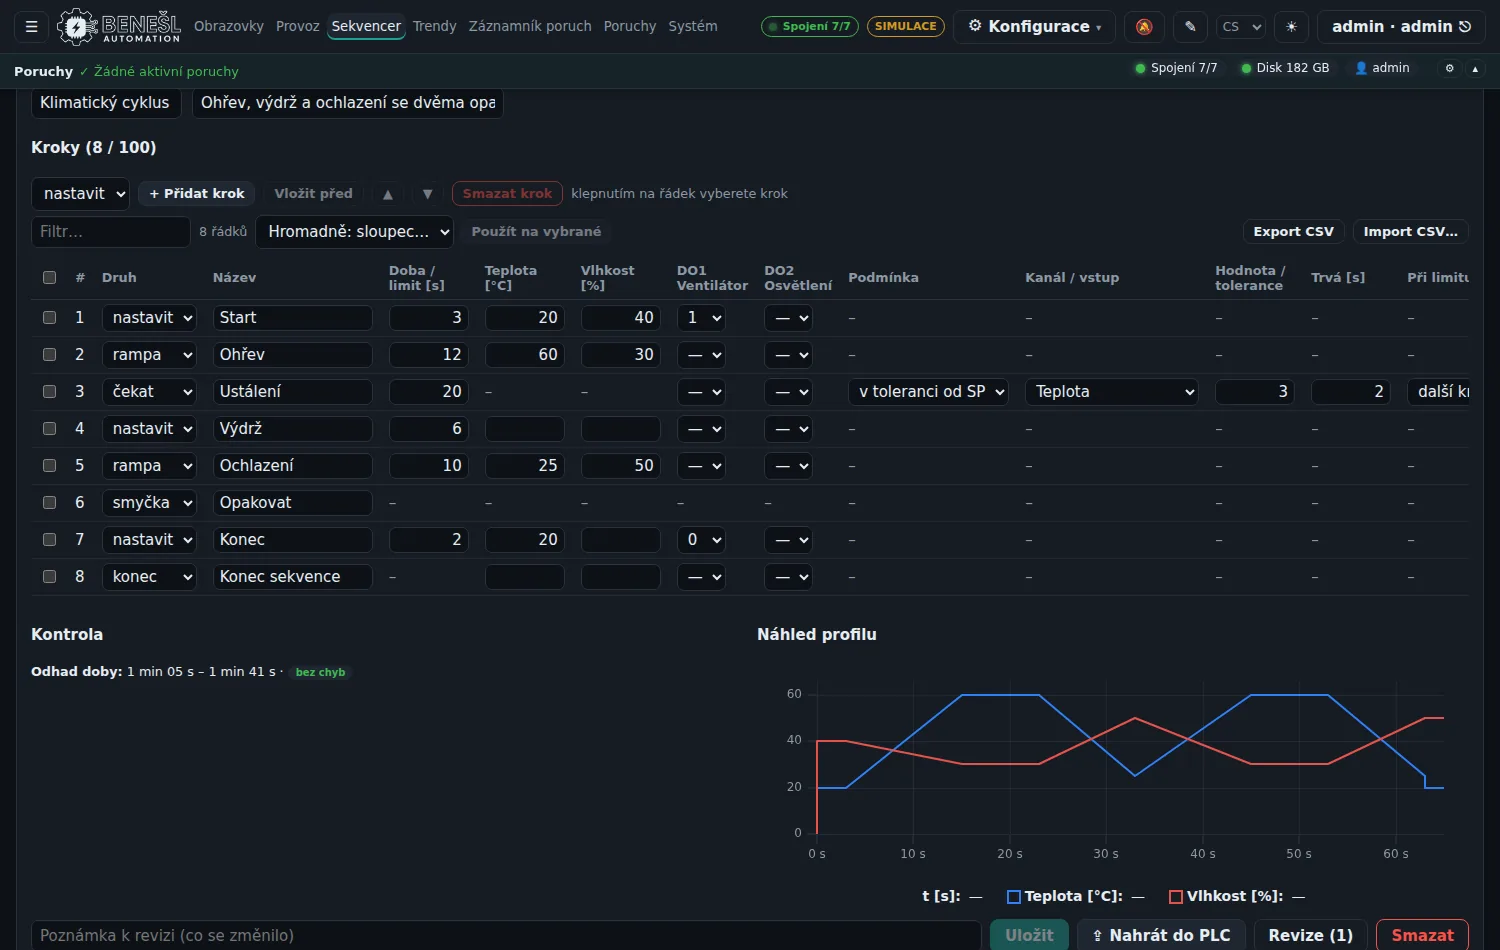
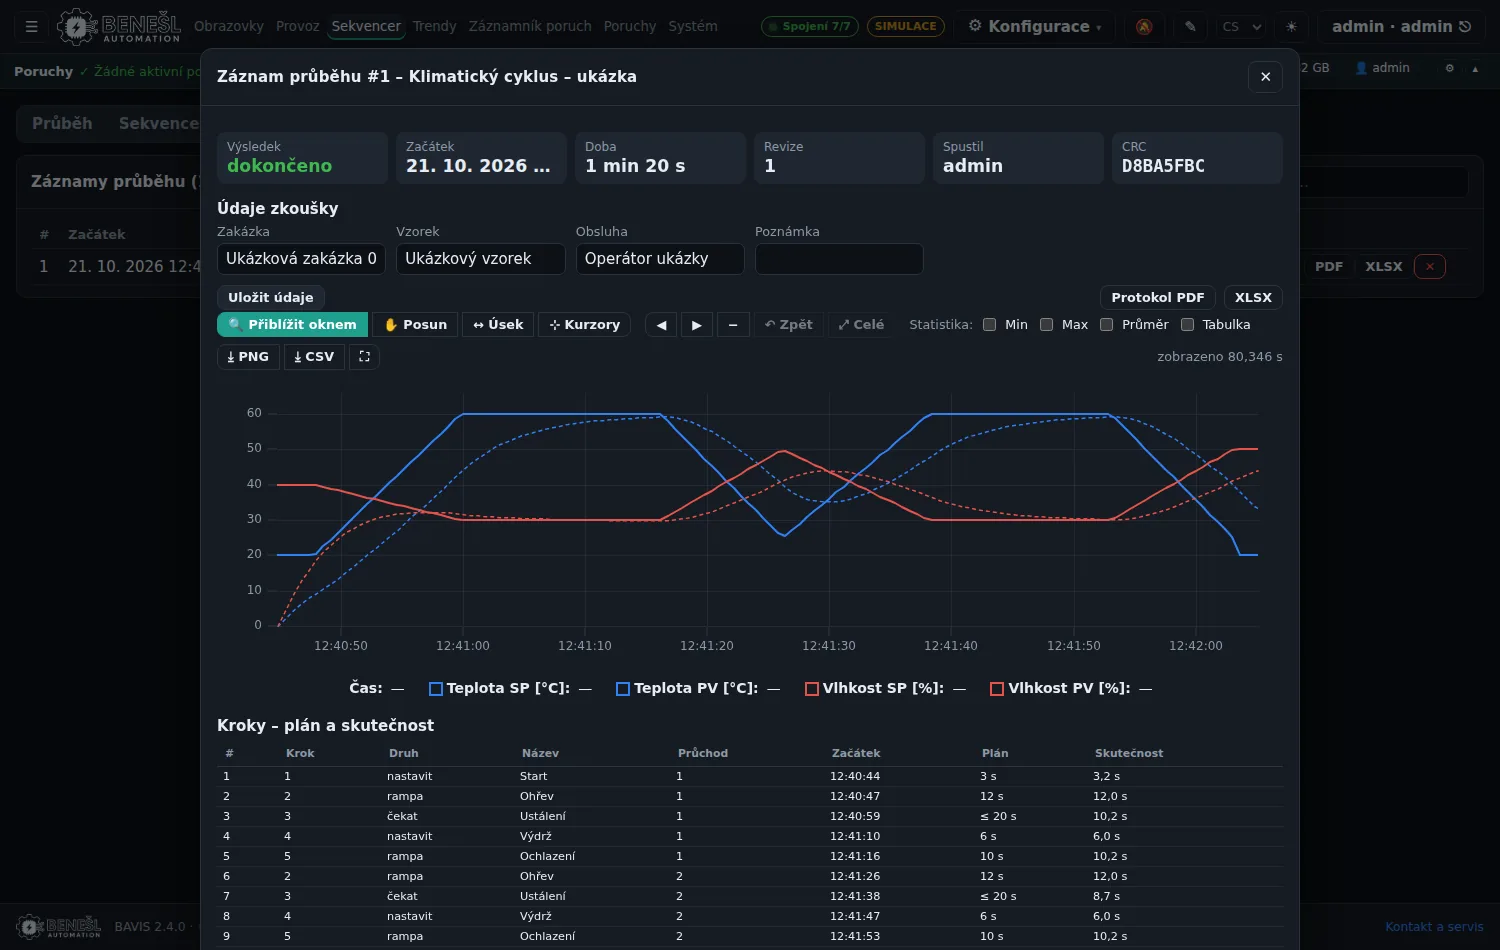
- Test sequencer: editor with checks and profile preview, record of a completed test.
- Fault recorder: signal waveforms around a fault with millisecond resolution.
- Traceability: batches, serial numbers, genealogy and the electronic batch record.
- Error reporting: exactly what the report contains before it is sent.
- Configuration without programming: connections (including M-Bus, BACnet, KNX), tags, alarms, screens, users and roles.
The data in the demo are simulated. Functions that need real devices, a network or a server (communication, download to the PLC, sending reports, BAVIS Central, file downloads) are only described by the demo.
Demos by industry
Same application, different industry. Each demo is a project created from a BAVIS industry template with one click, running on a simulation: process screens, alarms, trends, energy and maintenance. Logging in and operating work the same as in the demo above.
Wastewater treatment plant
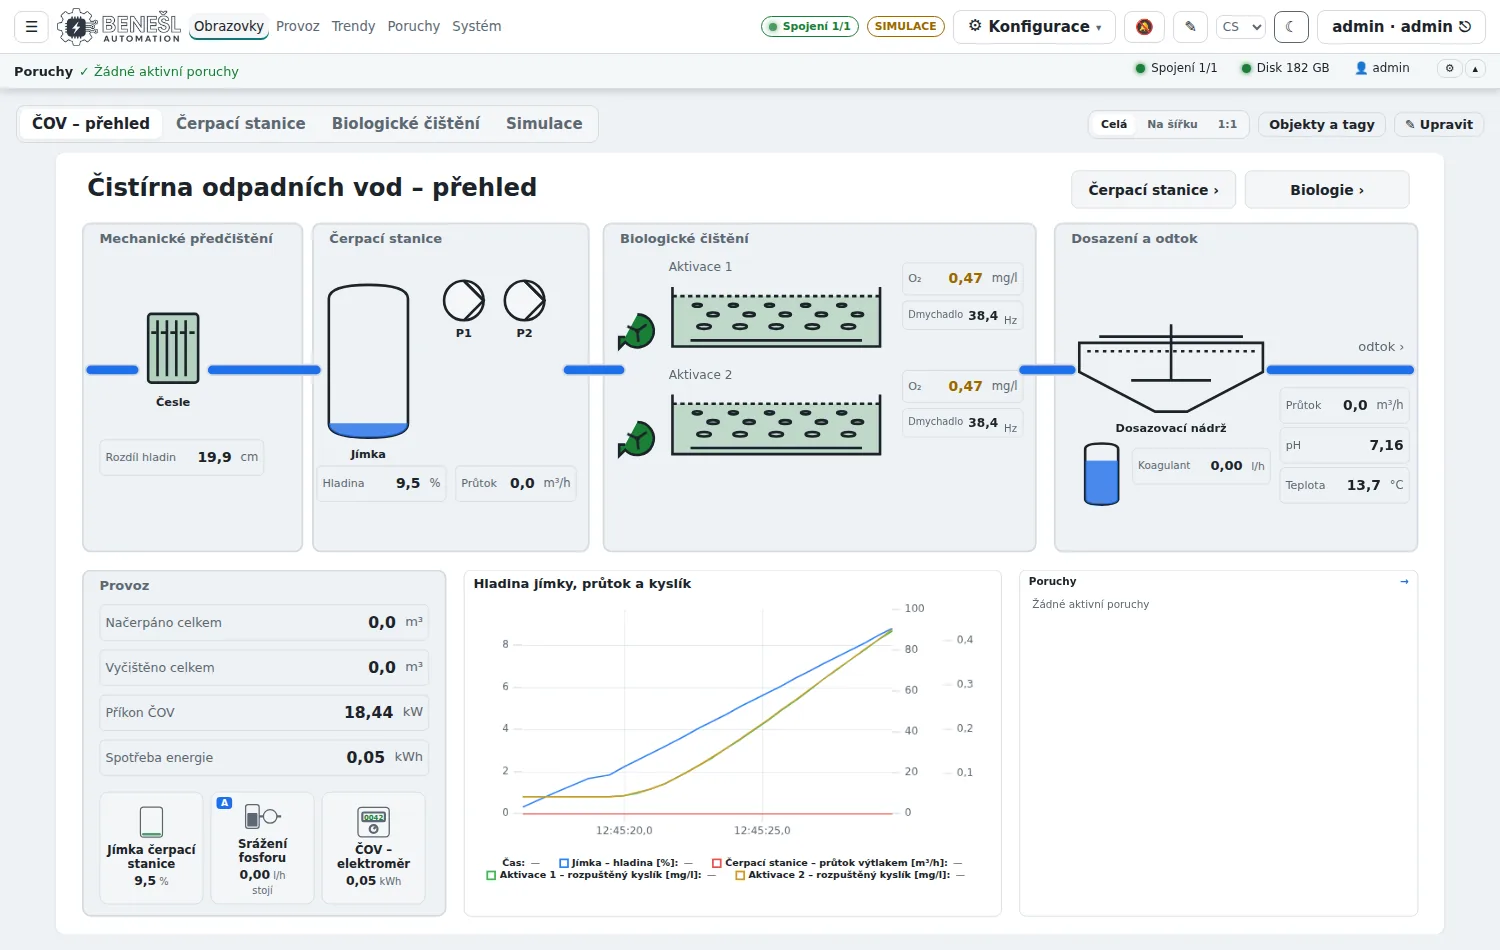
Screening, a pumping station with a sump, two aeration tanks with oxygen control, coagulant dosing and an outflow with flow, pH and temperature measurement.
Waterworks
Two wells, a treatment plant with filtration and disinfection, a reservoir, an automatic pressure station and the network: pumps, levels, flows, pressure, turbidity and chlorine.
Boiler room
A cascade of two boilers, three heating circuits and hot water: temperatures, boiler modulation, circuit pumps and valves and gas and heat consumption.
HVAC / BMS
Two air handling units and four building zones: fans, heating and cooling, heat recovery, filters, temperature, CO₂ and humidity in the zones and time schedules.
Production line with OEE
Two lines with status, speed, good parts and scrap, OEE with availability, performance and quality, and the hall's power consumption.
Industry demos start without the dashboards and instruments of the general demo. The address without ?obor= opens the general demo again.
What's new in BAVIS 3.1
BAVIS 3.1 adds new drivers and device profiles for PLCs, buildings and energy, an energy manager, PackML, a network scanner and a friendlier editor. Data, configuration and projects from 3.0 are carried over unchanged and the new drivers are off by default, so an existing installation is operated exactly as before.
PLCs and industry
- New PLCs: Schneider Modicon and WAGO over Modbus TCP with variable import, CODESYS V3, Allen-Bradley SLC 500, MicroLogix and PLC-5, Beckhoff ADS with import from TwinCAT and an OPC Classic DA client.
- PackML: the machine state model, an Operation → PackML page and line OEE from a PackML machine including downtime reasons.
- Network scanner: finds known devices on the network and creates a connection with one click. The Check device button on the connection card tests the connection, reading and writing and saves the result as a PDF report.
Buildings and smart home
- A Home Assistant bridge and MQTT discovery from Home Assistant and Tasmota, Zigbee2MQTT, ESPHome, Tuya / Smart Life locally without the cloud, Shelly and BTHome Bluetooth sensors.
- PLCs for the home: Siemens LOGO! 8, Unipi, Loxone Miniserver and Tecomat.
- Automation: time schedules by sunrise and sunset, end of a washing machine or dishwasher cycle detected from power, and notifications via ntfy, Pushover and Discord.
Energy
- Energy manager: smooth control of PV surplus, spot prices, phases L1–L3, the main breaker and control of inverters and a wallbox.
- Inverters and meters: SunSpec (Fronius, SMA, SolarEdge, Kostal…), Huawei, GoodWe, Growatt, SolaX, Sofar, Sunsynk, the Solarman data logger and Eastron, Chint, Carlo Gavazzi and ABB meters.
- Charging and weather: OCPP 1.6J for wallboxes, PV yield forecast from Open-Meteo and ripple control (HDO) signals.
Operators and integrators
- Screen editor: Back and Home actions, a screen dragged onto the canvas becomes a navigation button, and a searchable element palette.
- Operation: zoom on a phone and clear error messages instead of technical exceptions.
- A public SDK for your own drivers (API 1.0), and the new drivers in the licence edition tables.
Maintenance release 3.1.1
Data, configuration and projects from 3.1.0 and 3.0.x are carried over unchanged. The supported lines are 3.1.x and 3.0 LTS. How long each version receives fixes
- BAVIS Maker up to 5,000 tags: the edition that is free for non-commercial use at home and in the workshop is out. You activate it under System → Licence → BAVIS Maker, with registration in BAVIS Central.
- Interface: a slow, older server response, for example during project activation, no longer overwrites a newer state, and the SIMULATION bar shows the running scenario right away.
- BAVIS Central menu: Sites appear in the menu only once, and pages such as Sequencer, Dashboards, SOE or Calibration come before Configuration and System.
Coming next: BAVIS 4.0
Version 4.0 will bring official support for Linux, Raspberry Pi and Docker, an optional PostgreSQL database, the project in Git and dozens of new drivers for buildings, energy and the smart home. It will take over data and projects from 3.x without loss. We are planning it for 2027. What BAVIS 4.0 brings
The manufacturer and product names mentioned are trademarks of their respective owners.
What's new in BAVIS 3.0
BAVIS 3.0 is a major release: the HMI for a test lab becomes a general, fully configurable SCADA. It brings an optional AI assistant, a stable API v1 for integrators, history and alarms over OPC UA, DNP3, import from TIA Portal, a task scheduler, notifications with escalation, a mobile view for operators, sites in BAVIS Central and licence editions including the free Lite edition for non-commercial use.
Versions 2.5 to 2.7 mainly add tools for day-to-day operation and maintenance: dashboards built from widgets, instrument calibration records, maintenance with work orders and service intervals, device types, an oscilloscope with FFT, alarm analysis according to ISA-18.2, an audit trail with electronic signatures and scheduled reports.
BAVIS 2.4 extends the web SCADA with what is usually handled outside it: energy meters and buildings (M-Bus, BACnet, KNX), test control and recording directly in the PLC, fast fault recording with millisecond resolution, batch traceability and management of multiple installations from one place. You create a new project for common industries from a template, simulation included, and when something goes wrong, BAVIS prepares a diagnostic report for service by itself.
All new settings have a table and a step-by-step wizard and are switched off by default – existing projects behave exactly as before after the update.
New in 3.0
- AI assistant (optional, off by default) with a local model or a service of your choice: questions about history and alarms, a shift summary, a screen proposal from a list of tags and an explanation of why the line stopped. It only reads data.
- Integration: a stable API v1 with an OpenAPI description, an OPC UA server with history, alarms and the Machinery companion specification, DNP3, webhooks and MQTT output for ERP, MES and the cloud.
- Import from TIA Portal – tags, alarms, UDTs as device types and screens from data blocks and tag tables.
- Operation: a task scheduler, a simulation mode without a PLC, alarm notifications to mobile and e-mail with escalation, alarm analysis according to EEMUA 191, system health and export of tables and charts to Excel and PDF.
- Operators and mobile: an ISA-101 look, themes and contrast, favourite pages, keyboard shortcuts, language and units per user and a mobile app (PWA) with alarm notifications.
- Licence editions: Lite free up to 150 tags for non-commercial use, Standard by number of tags, further protocols and functions separately or in bundles.
- BAVIS Central: fleet and sites with a map, installation health and bulk updates in waves within a service window.
Operation and maintenance (2.5–2.7)
- Dashboards: your own pages built from widgets (summaries from history, gauges, trends, bar charts, alarms) without programming, shared with everyone or just for yourself.
- Instrument calibration: an instrument register with calibration history, due dates monitored as alarms and correction of tag values according to the calibration curve.
- Maintenance: work orders with priority and status, service intervals by time and operating hours, a spare parts store and QR labels for equipment.
- Device types – define a pump, valve or sensor once and insert it as ready-made instances with tags, alarms and a symbol.
- Oscilloscope with trigger, cursors, measurements and FFT on live tag values.
- Alarms and audit: alarm analysis according to ISA-18.2 with export to PDF and XLSX, an audit trail of changes and electronic signatures for sensitive operations.
- Scheduled reports with charts, shifts from the calendar and delivery by e-mail, webhook or to a folder.
Communication and drivers
- Energy meters: M-Bus (converter on a COM port or an M-Bus/TCP gateway) and wireless wM-Bus including encrypted telegrams – the wizard finds the meters, reads their records and creates the tags and the meter object.
- Buildings: BACnet/IP as a client (device discovery, read and write with priority) and as a server, and KNX IP (tunnelling, routing, KNX Secure) with import of group addresses from ETS.
- Modbus RTU on a serial line and via a gateway, including device search on the line and slave mode.
- Built-in MQTT broker with a unified namespace according to ISA-95 (UNS) and optional Sparkplug B – data for MES and the cloud without another server; writes from MQTT only to permitted tags, with the same checks as from the screens.
- Modular architecture: drivers, faceplates, screen elements and symbols are separate modules – we add a new device without touching the core, and the module overview is right in the application.
- Every connection via a table or a wizard: bulk edits, CSV export and import, and a wizard with a test at the end.
Measurement and test benches
- Test sequencer in the PLC: an SCL function block for S7-1500 / S7-1200 executes steps downloaded from BAVIS (setpoints, ramps, waiting for a condition, loops). The PLC executes the steps; BAVIS prepares, starts and records the sequences.
- Sequence editor with limit checks, duration estimate and profile preview; download to the PLC with confirmation, CRC check and electronic signature.
- A record for every test: plan versus actual step by step, a chart of setpoints and measured values, a PDF and XLSX report.
- Fault recorder (SOE): a function block in the PLC records signals with 1 ms resolution into a ring buffer and on a fault stores the section before and after the event. BAVIS reads the record, reports it among the faults and shows it on a timeline comparing before / after the trigger.
- NI measurement cards (DAQmx) as connections (bridges, voltage, current) – calibration as tag scaling, connection test and a wizard.
- Changing the test bench PLC address in the interface: a wizard tests the connection to the new address and checks the CPU identity (type, serial number, firmware) before saving; after saving the connection switches over by itself, without a restart and with an entry in the operation log.
- One signal = one item in trends: a measurement service channel and a connection tag with the same source are no longer duplicated in trends.
- Photos for a test from a mobile phone via a QR code – without EXIF and GPS, straight into the report and the test record.
Central and fleet management
- BAVIS Central: an overview of all installations in one place – status, version, licence, faults and backups. An installation connects via an outgoing encrypted connection, without opening ports and without a VPN.
- Service without a VPN: remote access to the application and the PLC only after on-site approval, time-limited, with session recording and immediate termination.
- Updates and licences from Central: offers of signed updates and licences; the installation always verifies and installs them itself.
- Backups to a server: network share (SMB), S3, FTP / FTPS or Central – configuration, test records and history, optionally AES-256 encrypted, with a warning about a missing backup.
- PLC change monitoring and program backups: block fingerprints, who changed the program and when, online / offline comparison and a TIA Portal project archive – read-only, BAVIS downloads nothing to the PLC.
Screens and editor
- New project from an industry template: wastewater treatment plant, waterworks, boiler room, HVAC / BMS and a production line with OEE – connections, tags, objects, screens, ISA-18.2 alarms, reports, energy and maintenance in one step.
- Virtual commissioning: a project from a template runs straight away in simulation with fault injection; for Siemens S7 PLCs an SCL source of the interface data block for TIA Portal is generated.
- Pages from basic elements: screens and application pages are made of plain elements and ready-made groups – every element can be edited separately without programming.
- New faceplates and templates: heat, water, electricity and gas meters, heating circuit, boiler, air handling unit, lighting and blinds.
- Value element with a summary of several tags (maximum, minimum, average, sum, number meeting a condition).
Operation and service
- Automatic error reporting: we learn about a problem with your installation before you call us. On an error BAVIS prepares a diagnostic report by itself and sends it securely to our service – to the central BAVIS Central server, or by e-mail.
- No sensitive data: passwords, keys, IP addresses and production values are not sent; the administrator can review the report content in advance. A report waits until a connection is available, and the same error is reported at most once a day.
- Report a problem with one button: the operator describes the issue in their own words and the report is attached automatically.
- Traceability: batches and orders, serial numbers, forward and backward genealogy, process data and alarms per batch, and an electronic batch record with signatures and integrity verification.
- Traceability linked to the PLC via tags (batch start and end, quantity, serial numbers from a reader) and a REST API for MES.
- Wizards and tables for all settings – from alarms and tags to notifications, energy and time schedules.
BAVIS Central is our own server, not a third-party cloud service. It is a separate application, so it does not run in the public demo.
Maintenance releases 3.0.1 and 3.0.2
The 3.0 series has long-term support (LTS): it receives fixes and small improvements, while new features come in 3.1 and 4.0. Data, configuration and projects are carried over unchanged when you update. Data will carry over to version 4.0 without loss, but you can then only go back to 3.x from a backup taken before the update. Moving to 4.0
- 3.0.1 Activating a project from a package now also works for a service running under a virtual account. Forms, tables and the screen editor fit into a narrower window, for example a Home Assistant panel, and longer texts in screen elements no longer spill out of their frame.
- 3.0.2 Faster updates even with an archive spanning many years, and the screen editor on a phone. For test labs: gust test input as a table of cycles and sequences, with a pyramid on screen and in the PDF report, specimen failure details in the report, the end-of-test dialog shown only once even with several monitors, and chamber lighting controlled via WLED controllers (intensity, colour temperature, RGB).
BAVIS 3.1 also contains the fixes from 3.0.2. See the BAVIS 4 plan for what comes next. The BAVIS 4 plan
Screenshots of the 2.4–2.7 features
Screenshots from the public in-browser demo; the data are sample data from a simulation.
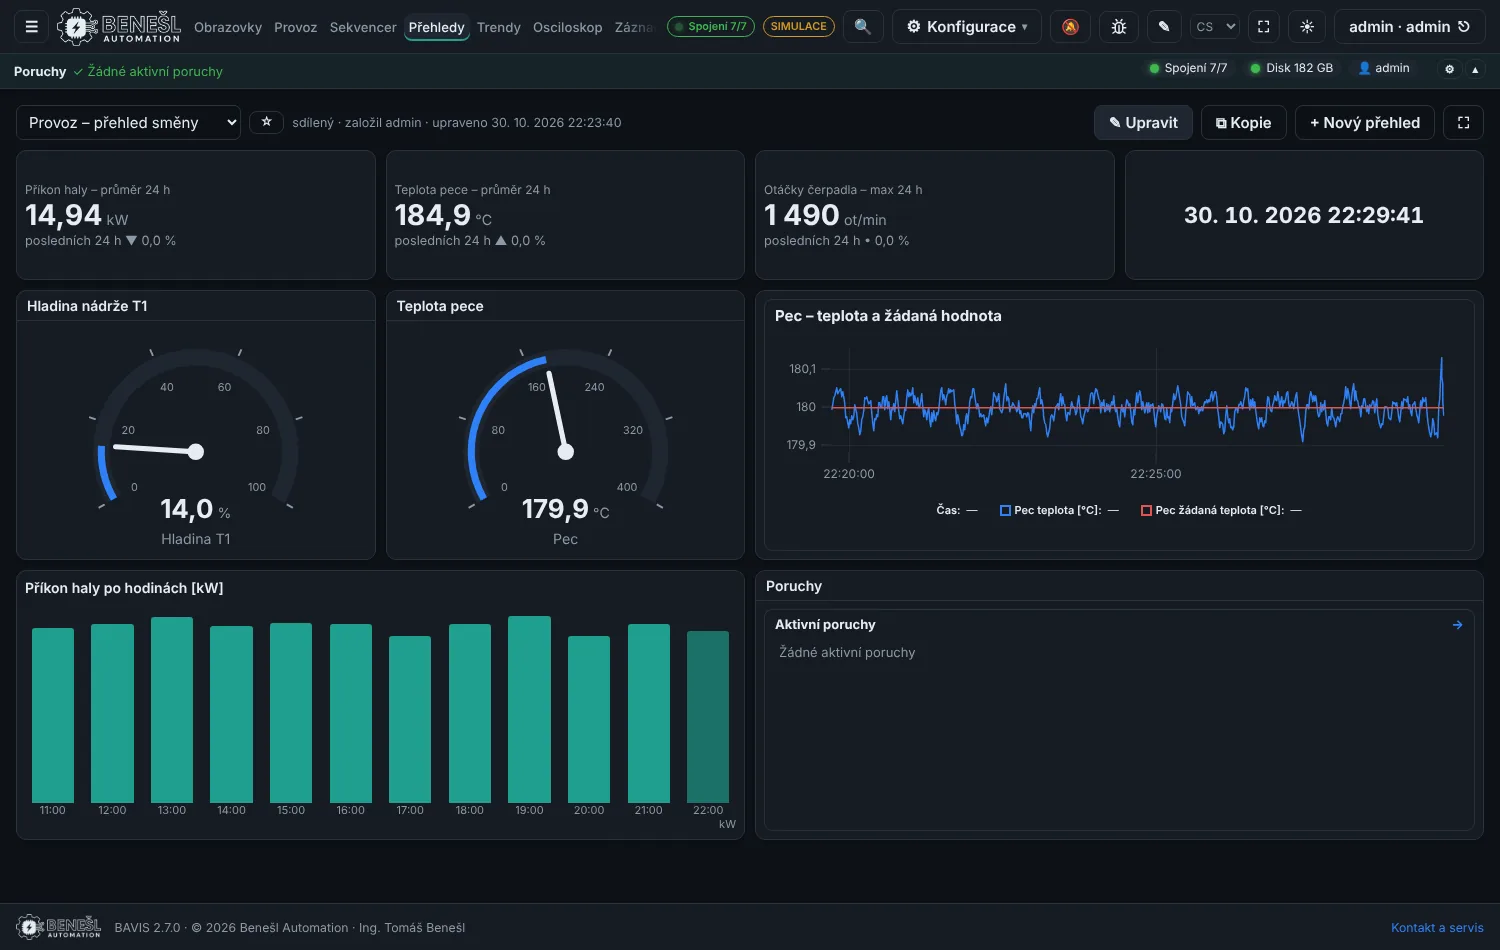
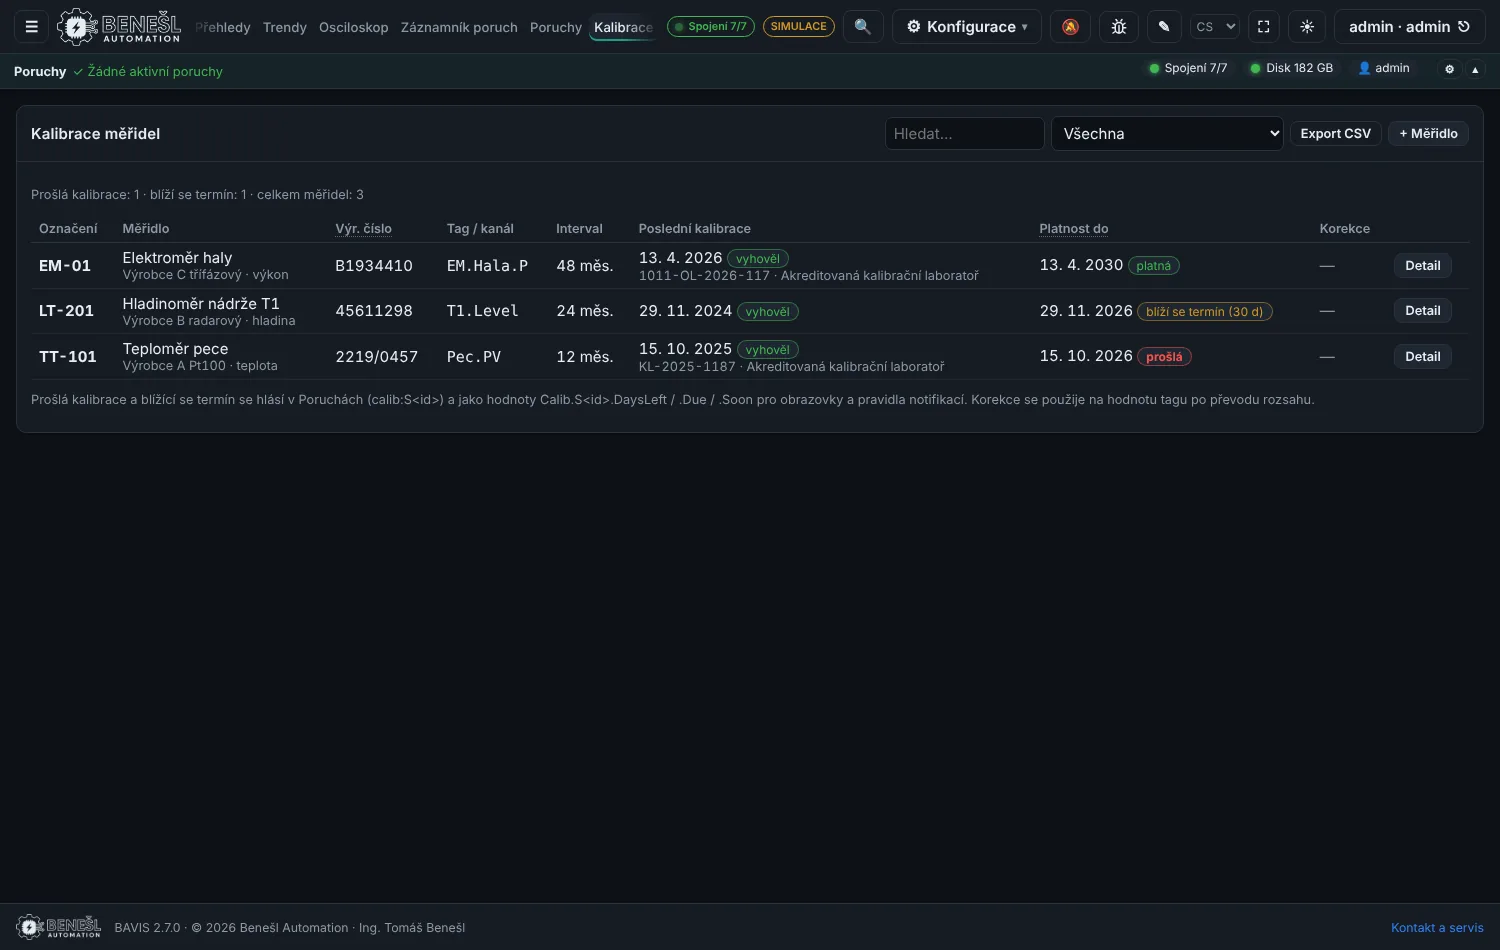
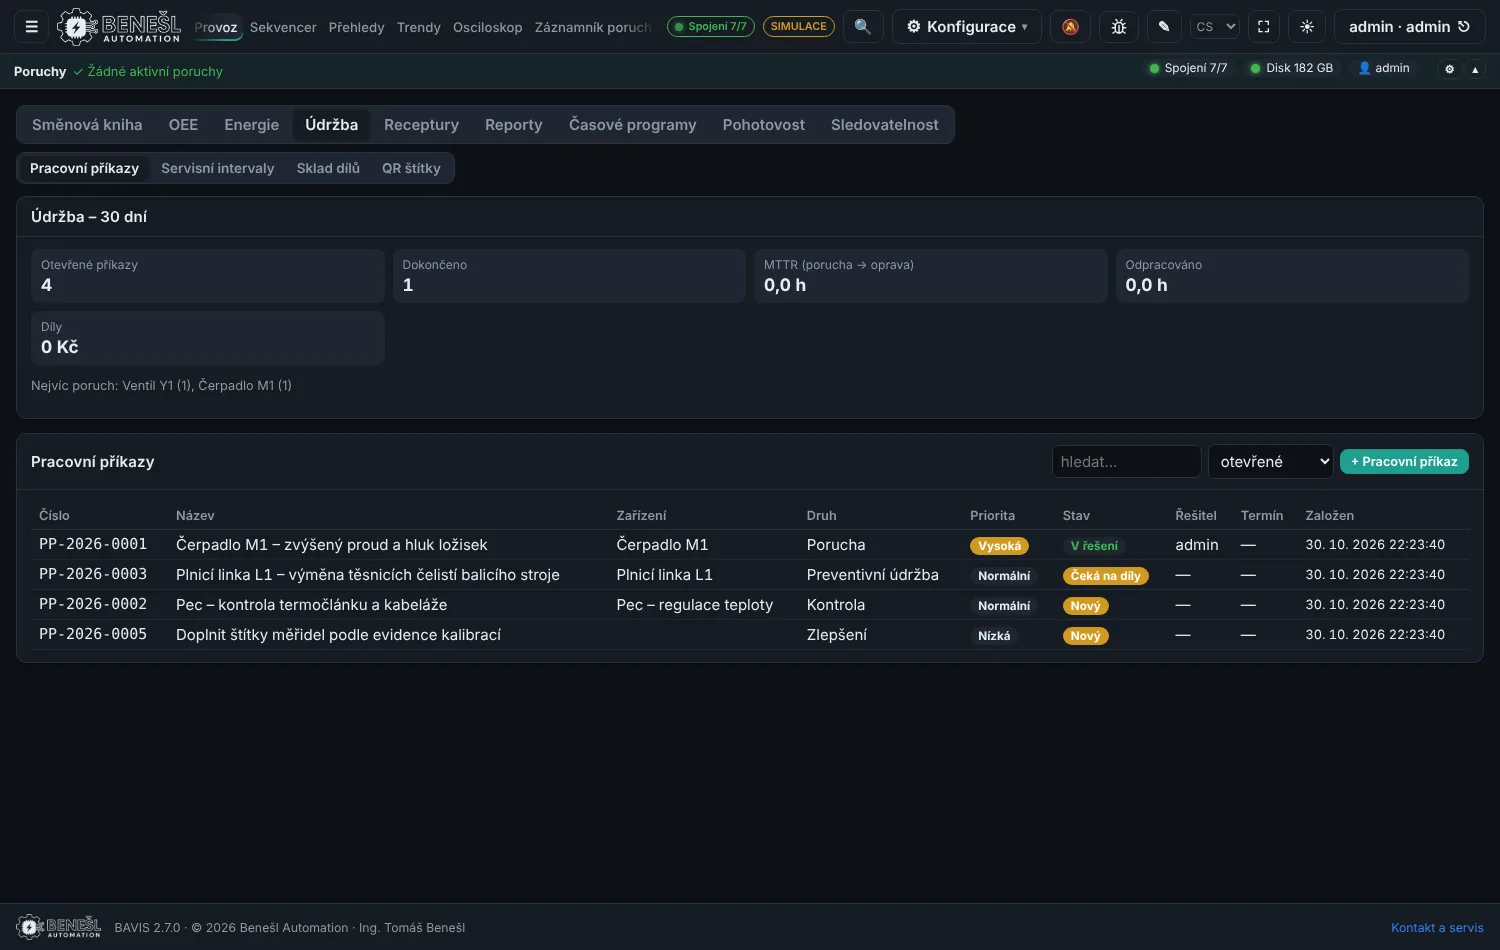
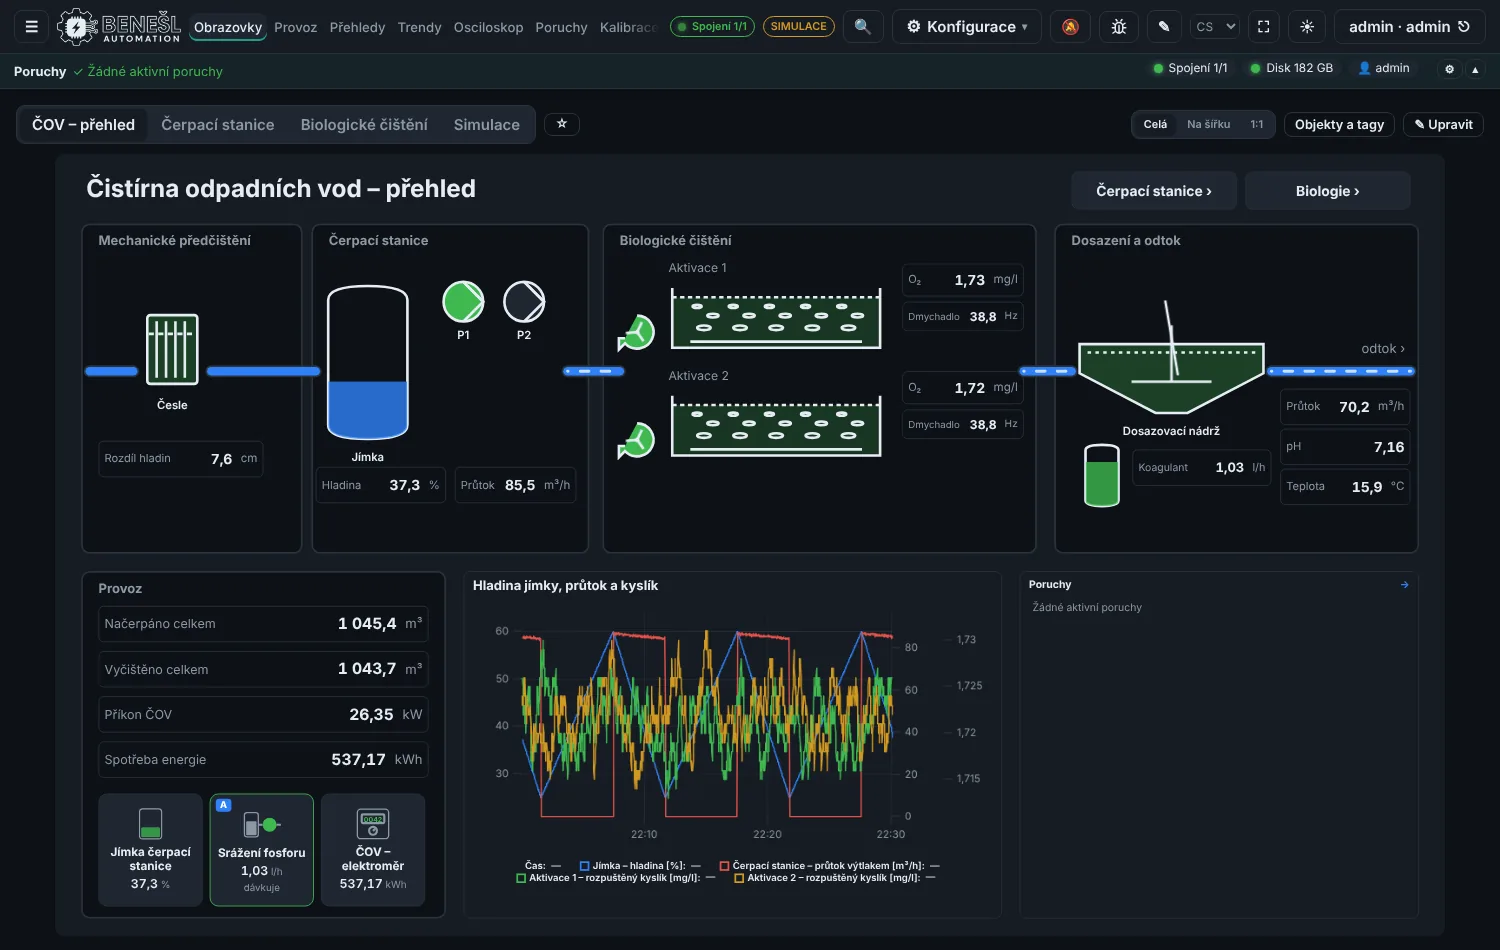
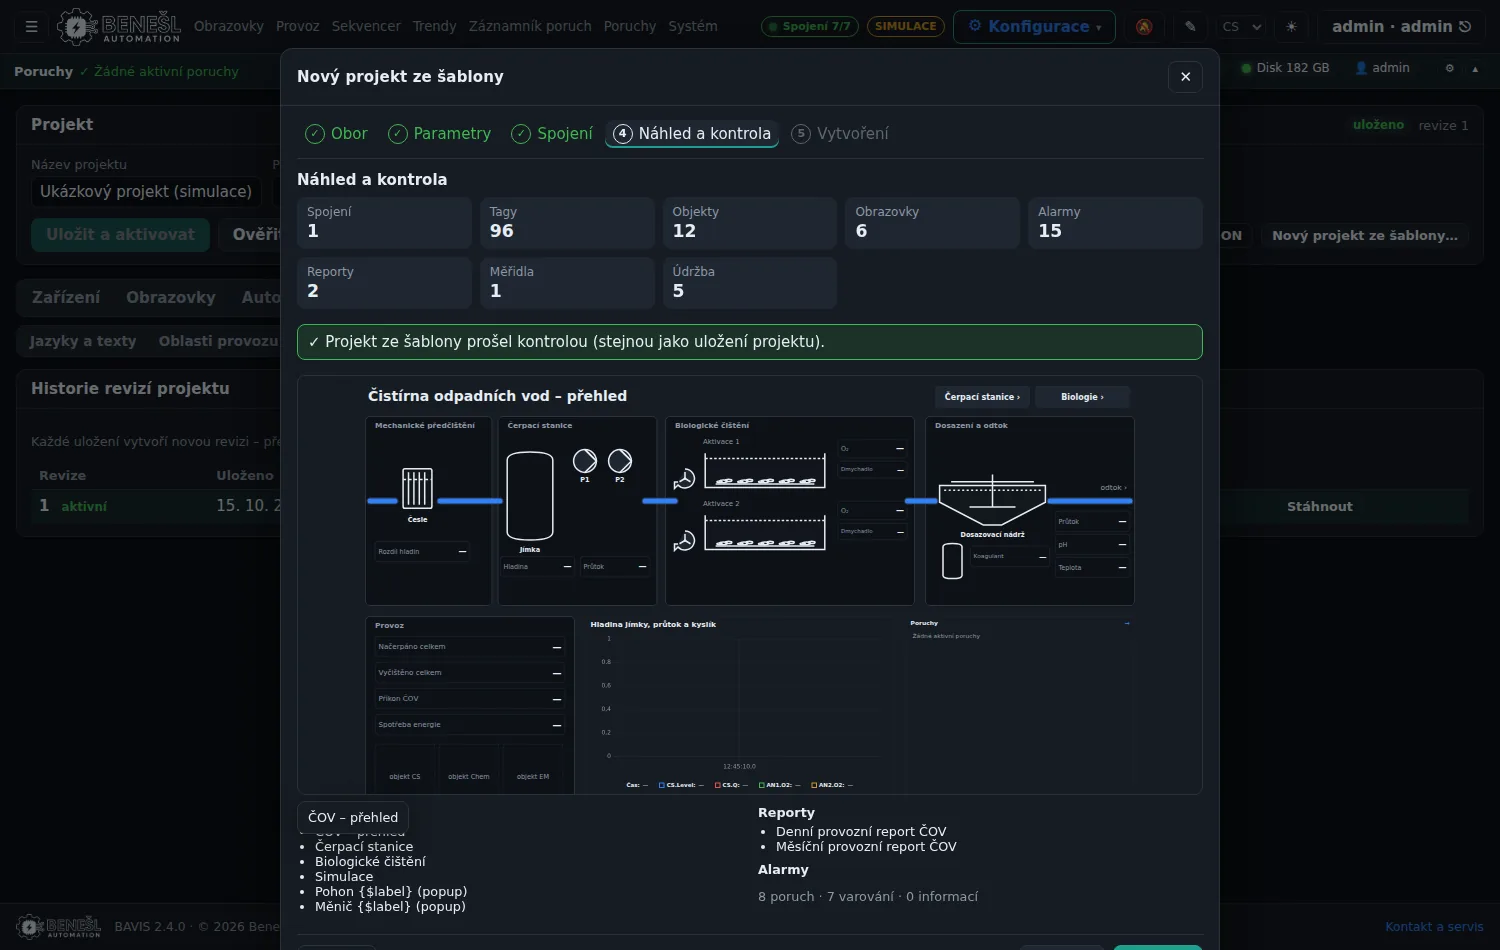
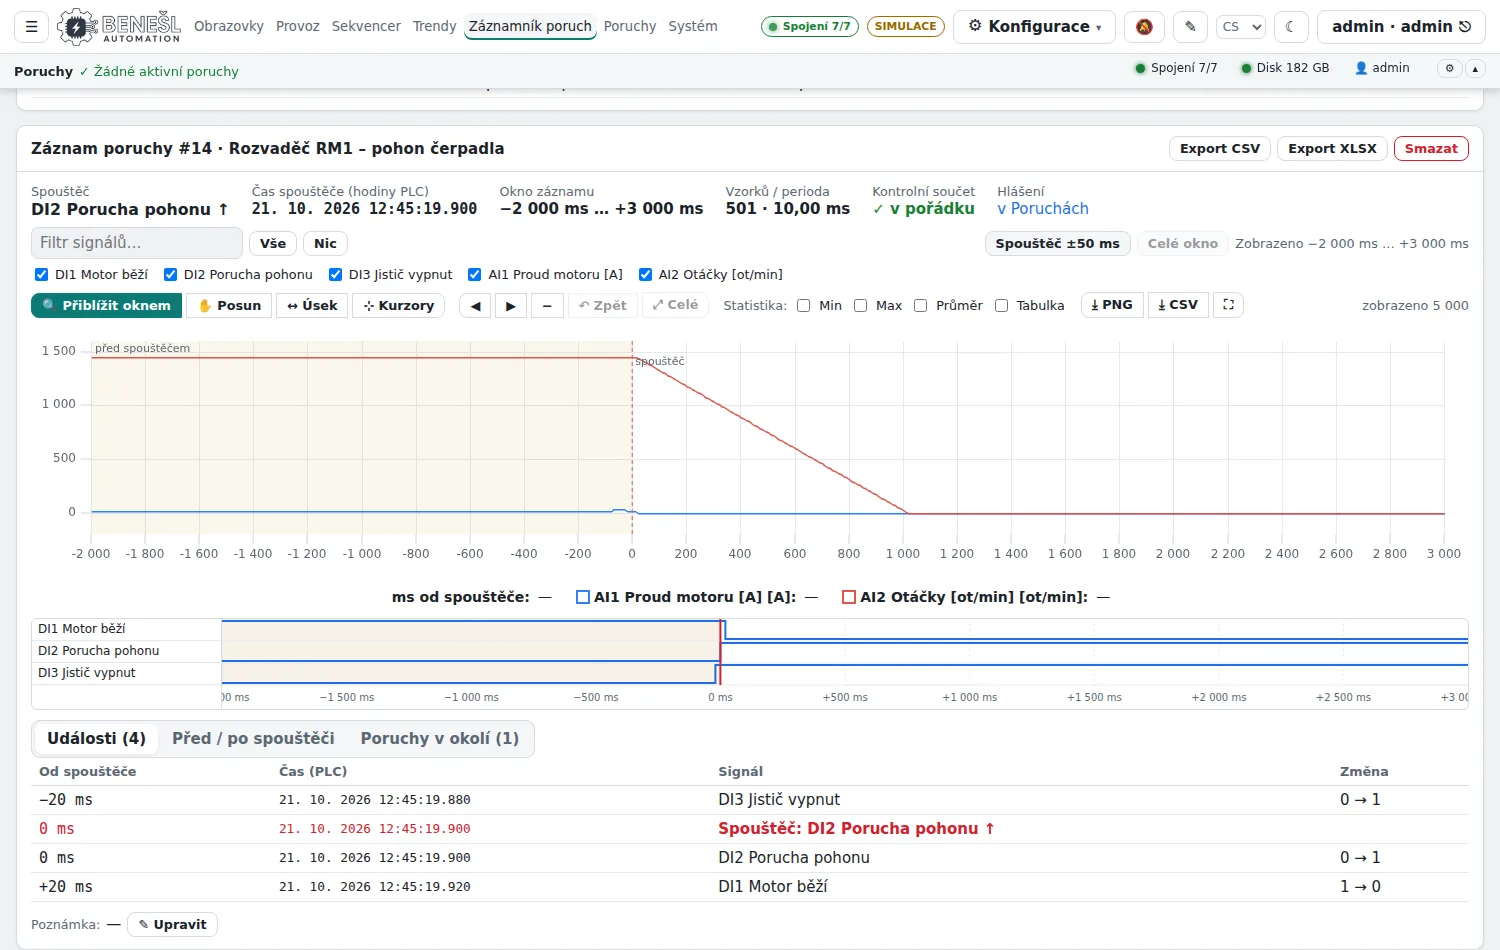
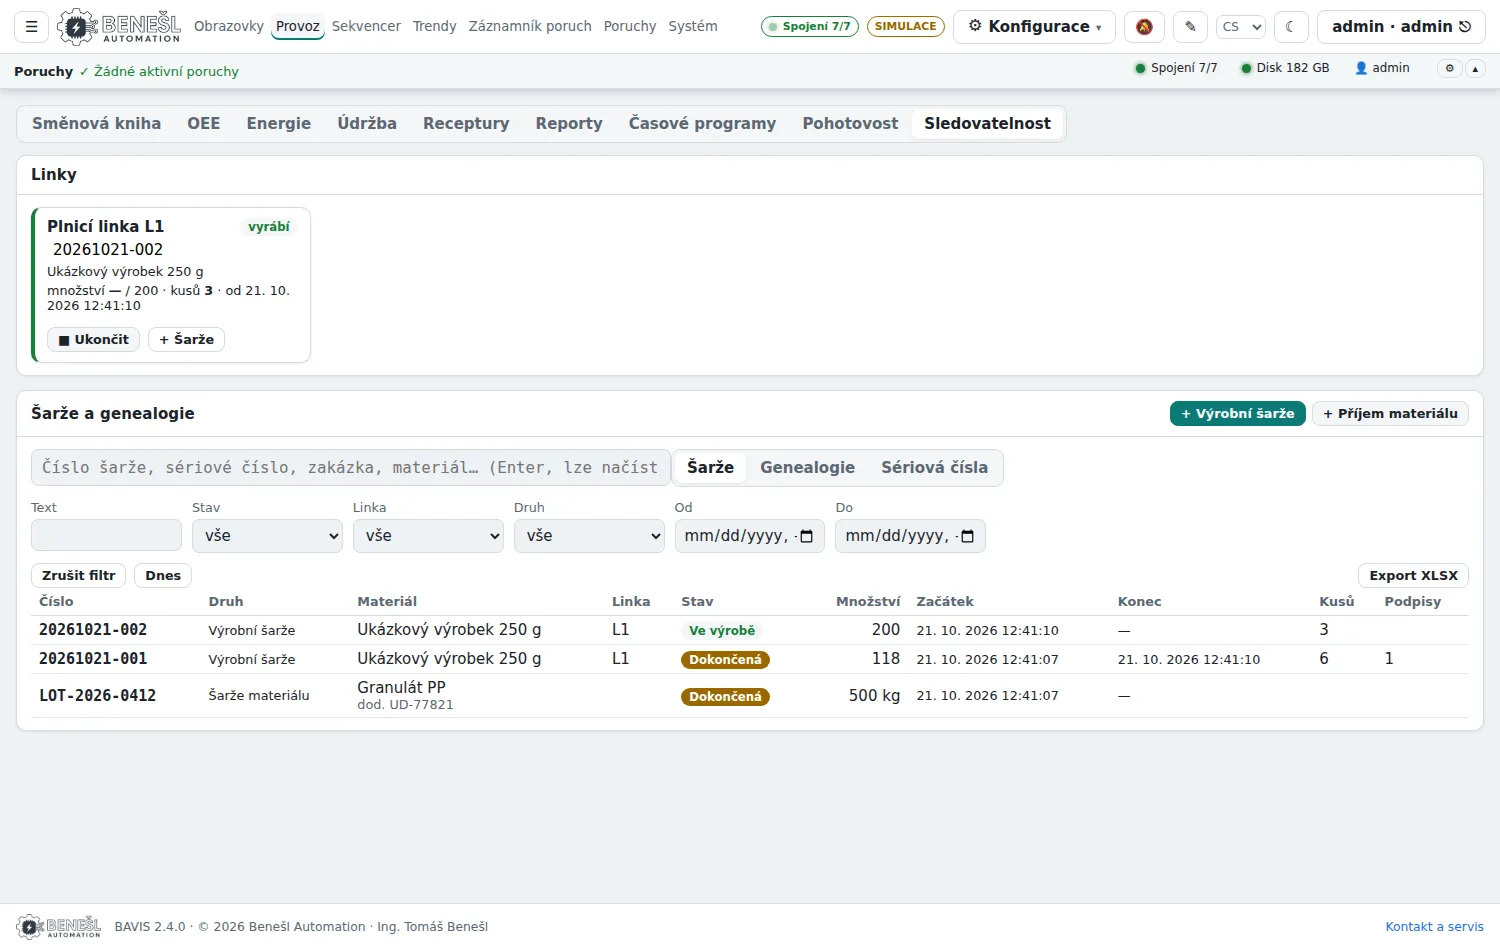
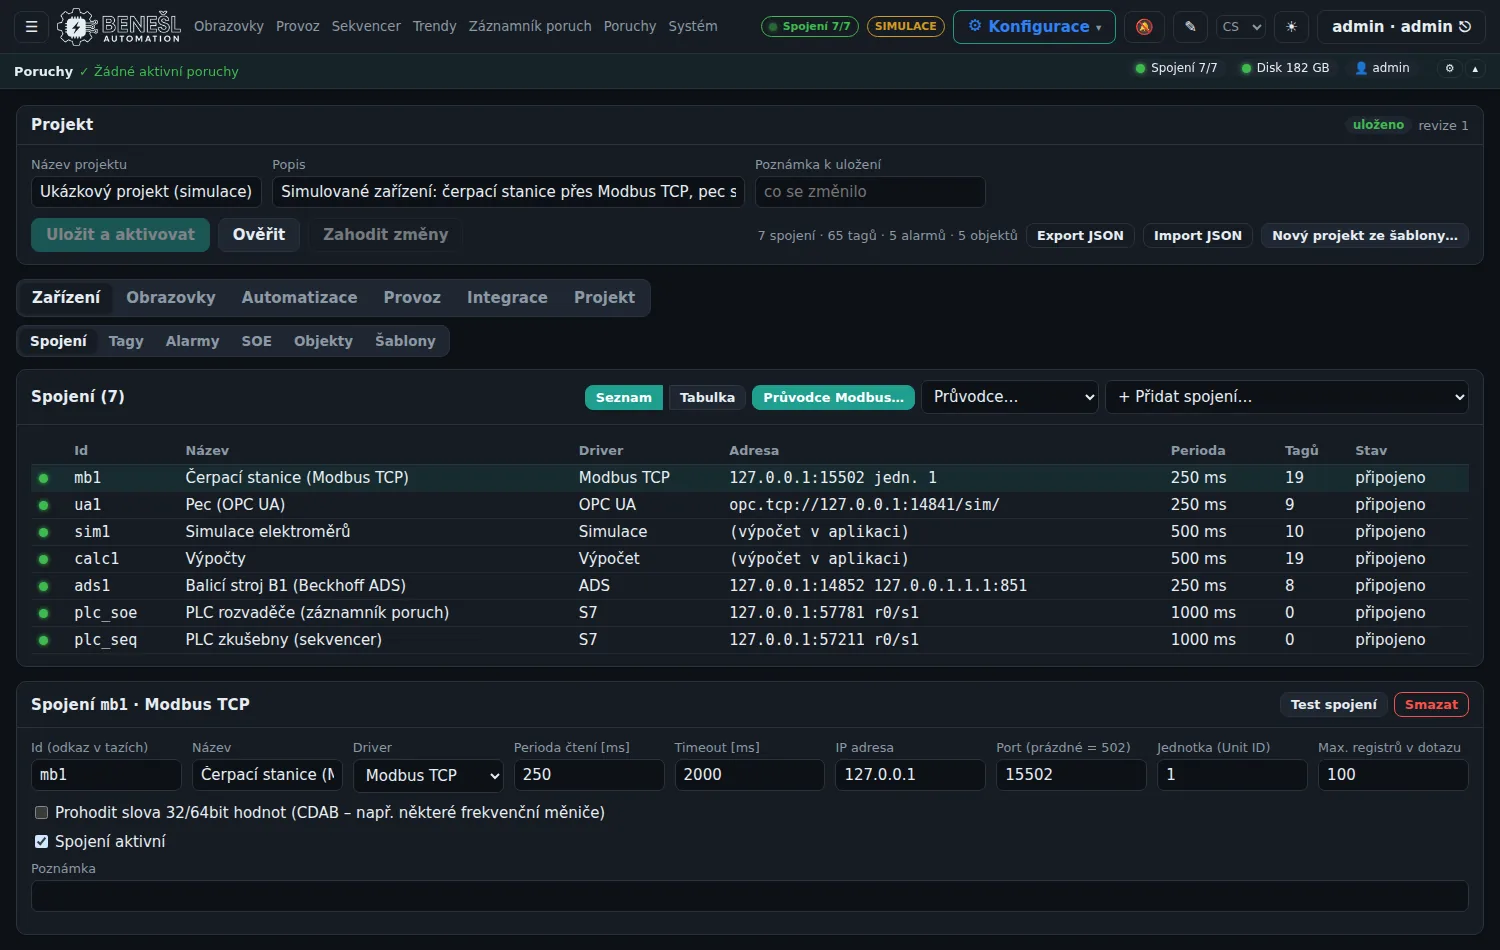
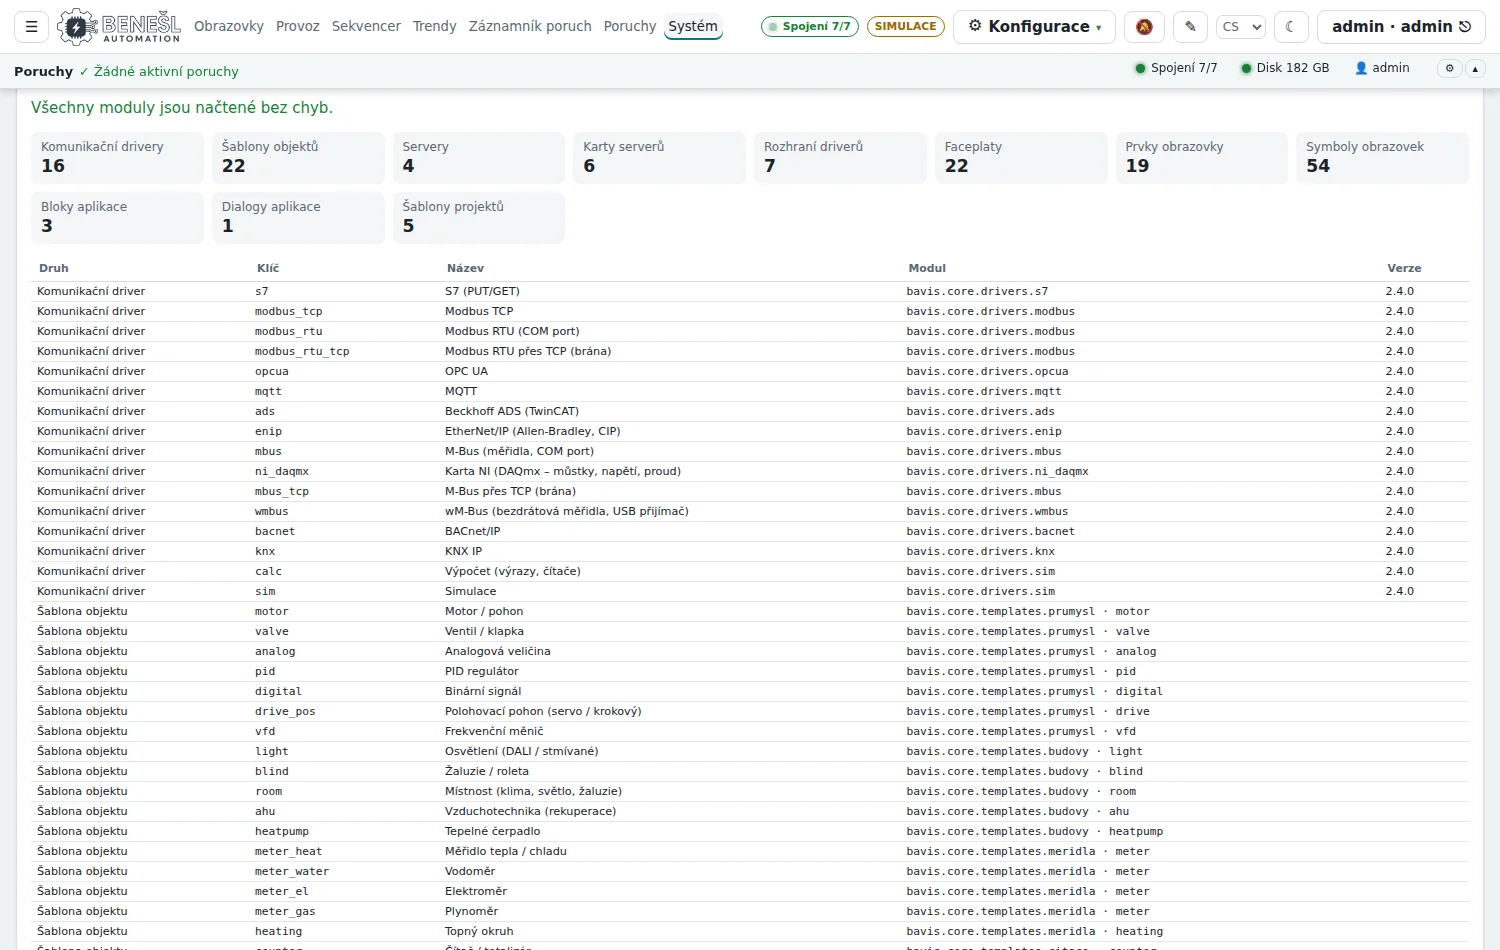
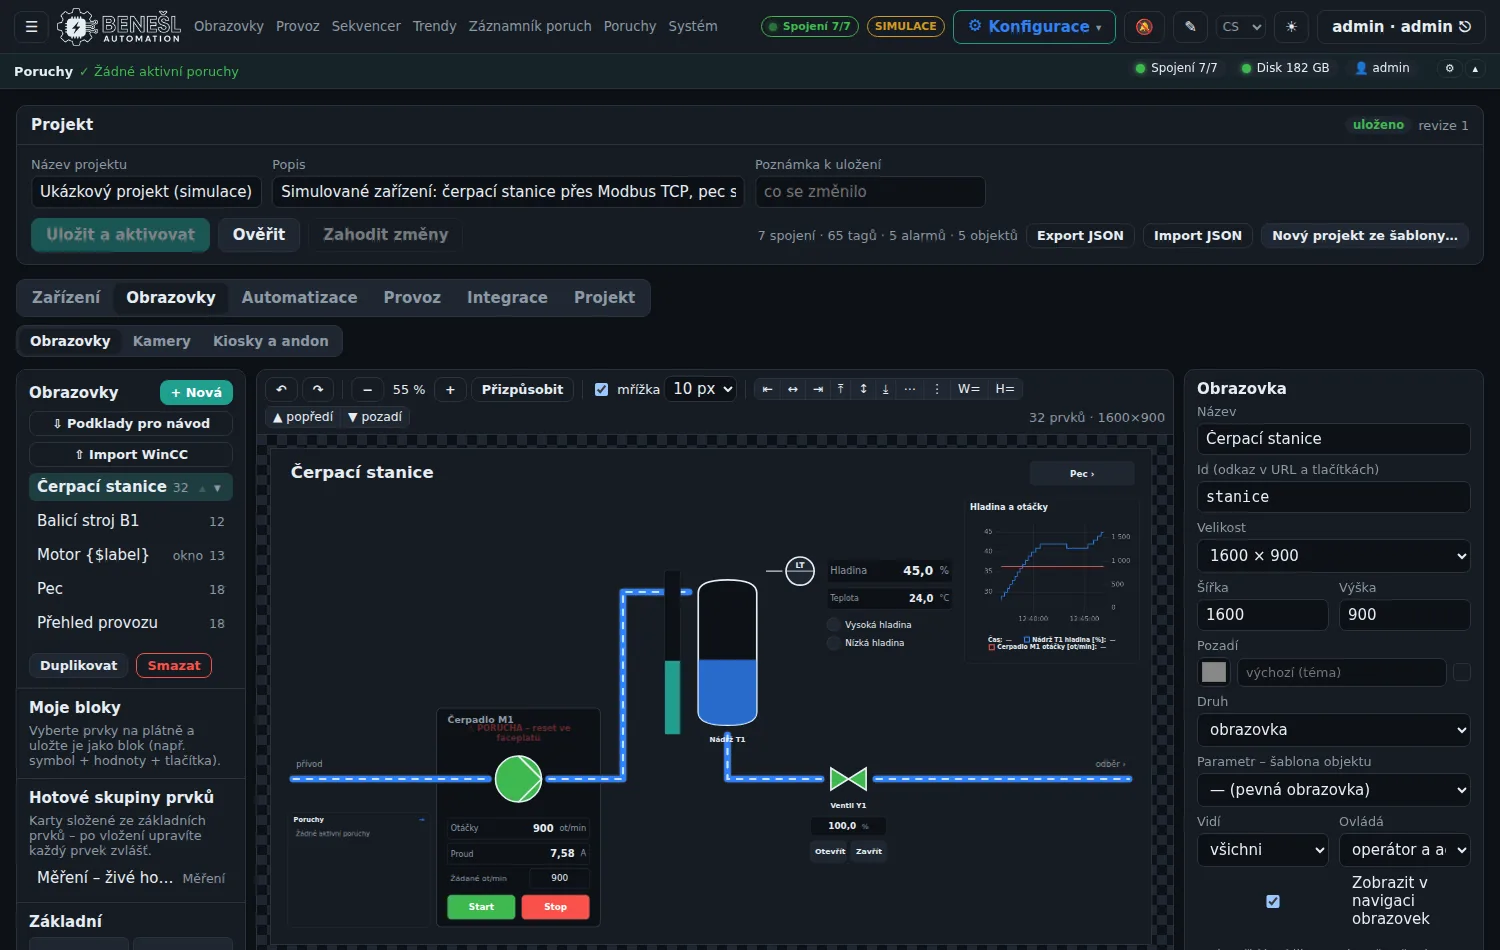
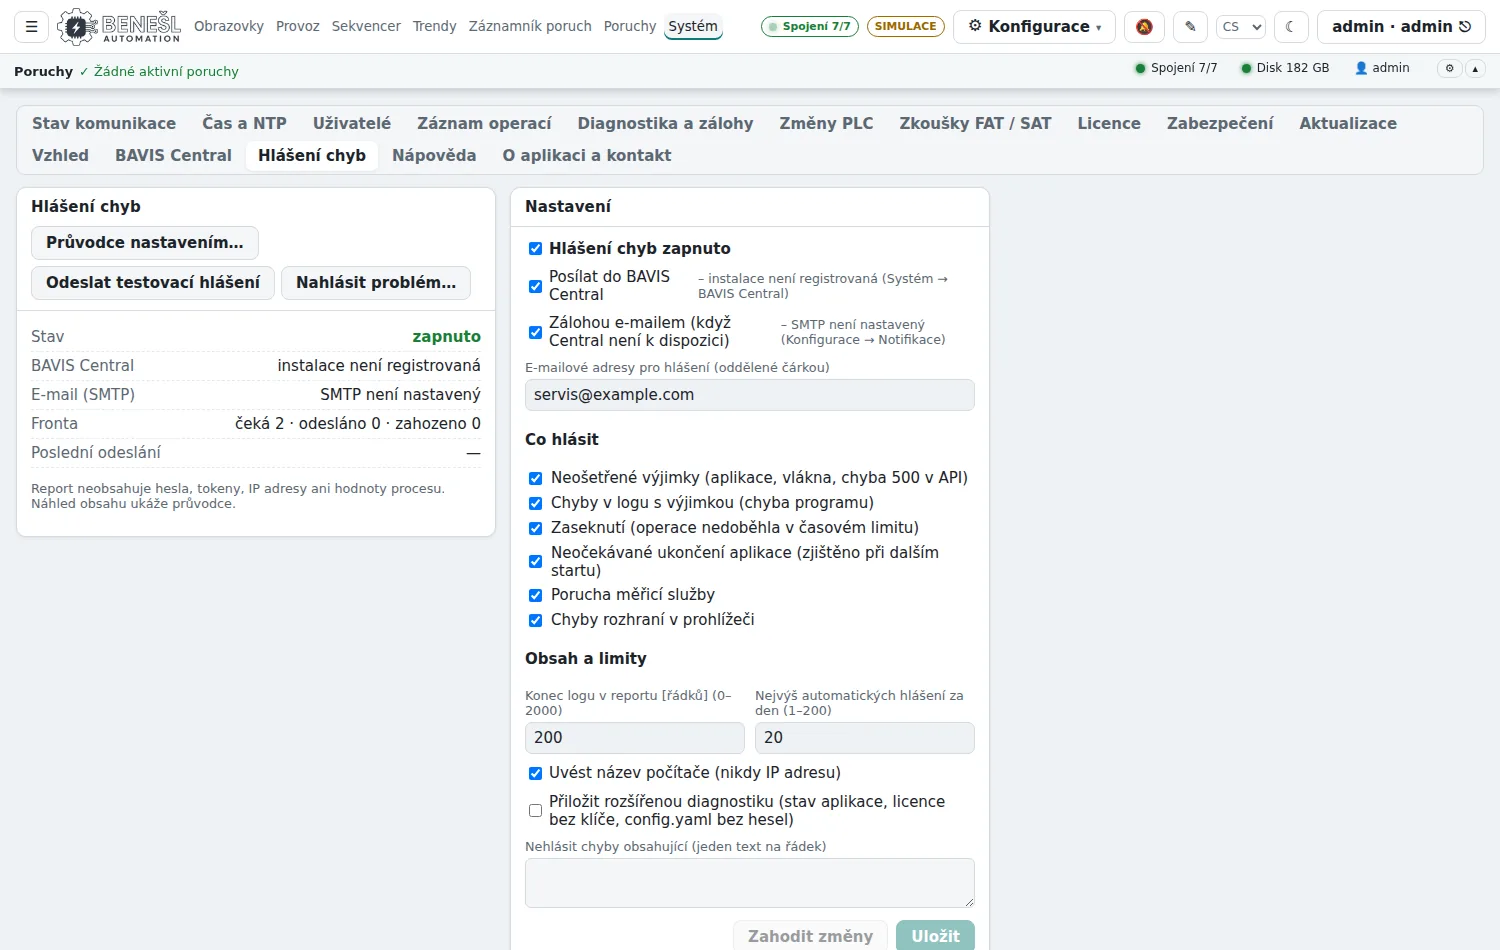
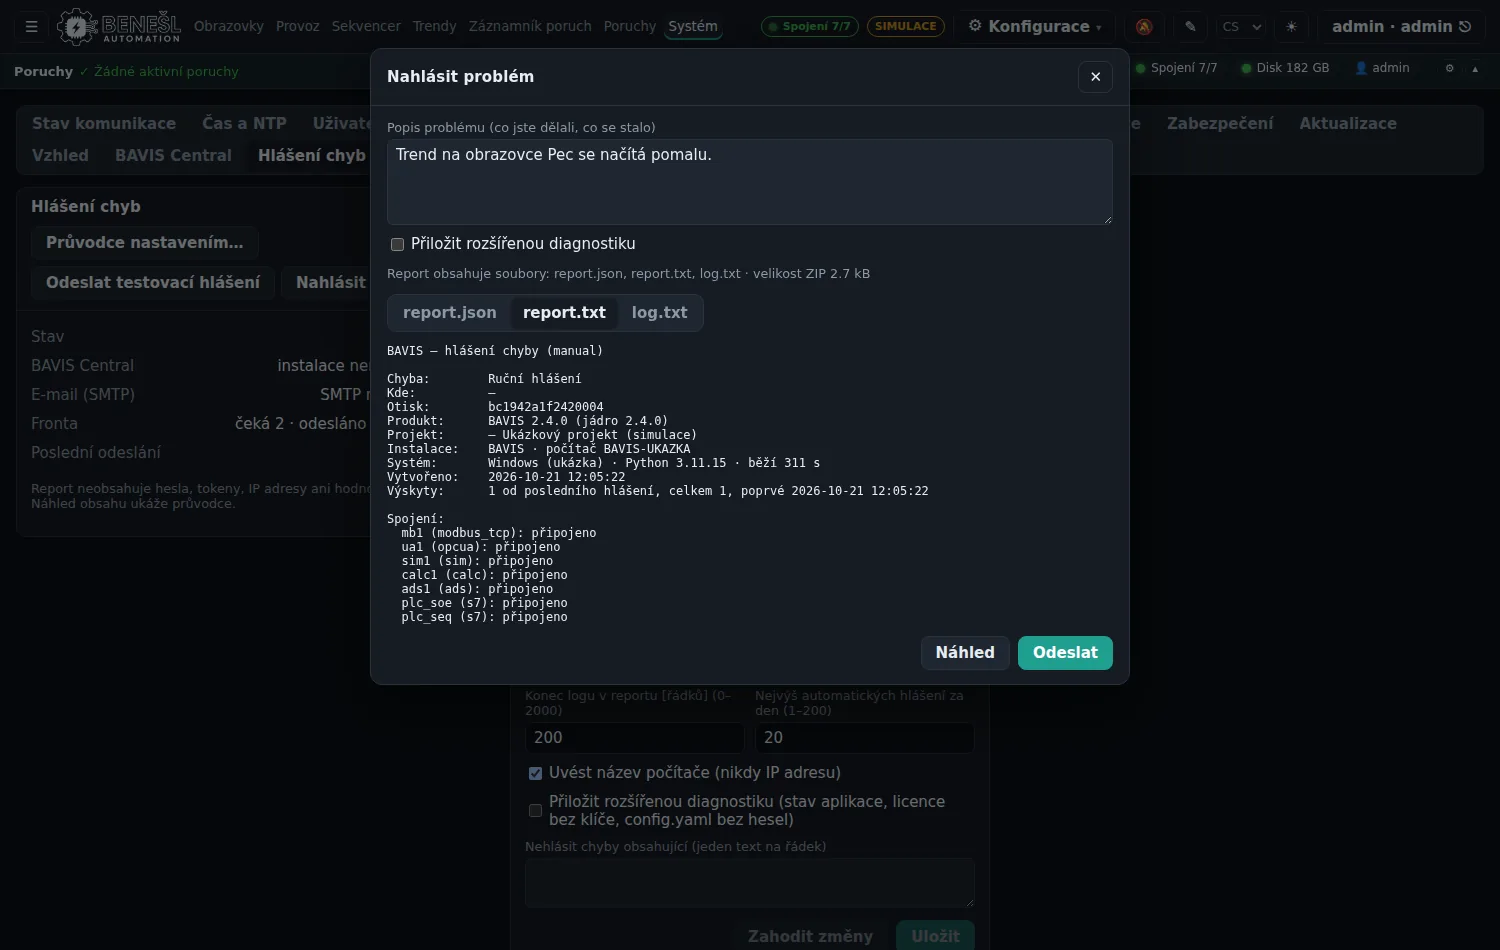
Siemens, SIMATIC, S7 and TIA Portal are trademarks of Siemens AG; Beckhoff and TwinCAT of Beckhoff Automation; NI and DAQmx of National Instruments; KNX of the KNX Association; BACnet is a trademark of ASHRAE.
Smart home on the BAVIS core
The same core can also handle a family house: a 3D model linked to live data, lights, blinds, underfloor heating and cooling ceilings, heat recovery ventilation, the pool and energy from photovoltaics with a battery. The demo runs against a simulation of the whole house; a Siemens S7-1500 PLC connects through a prepared data block.
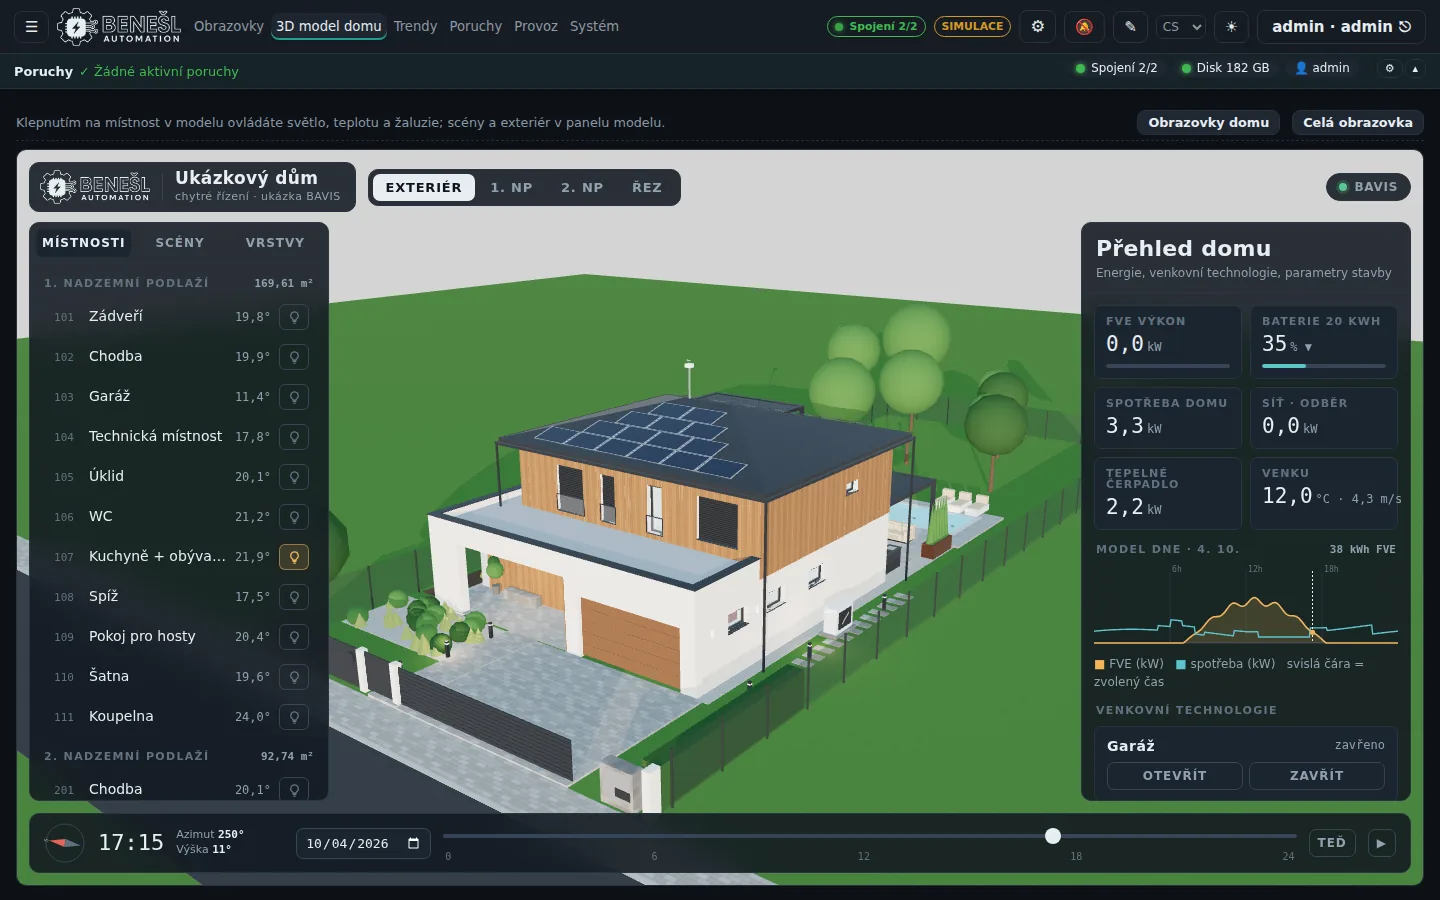
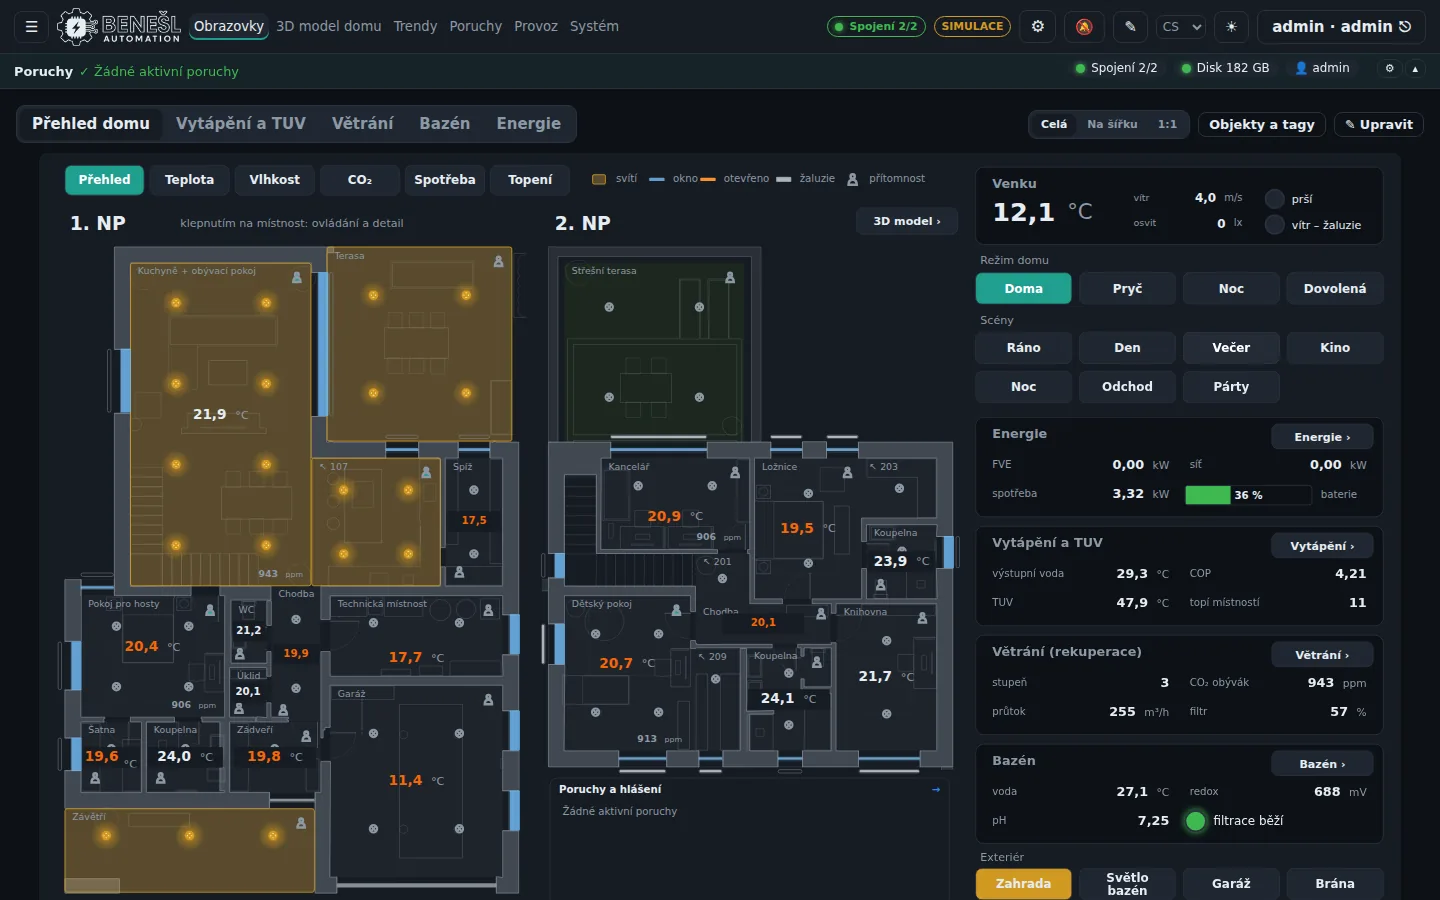
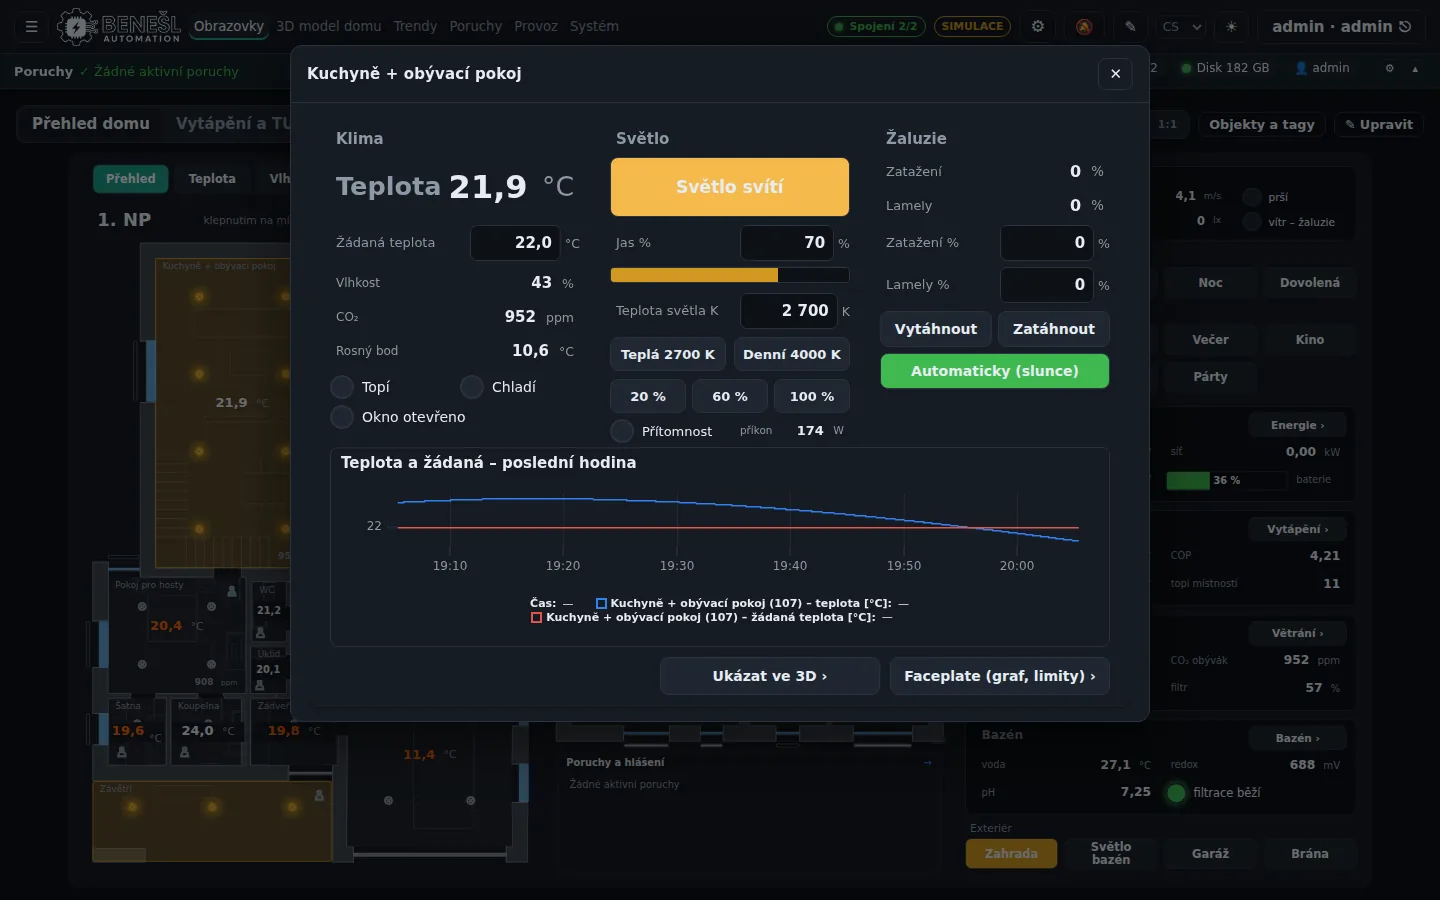
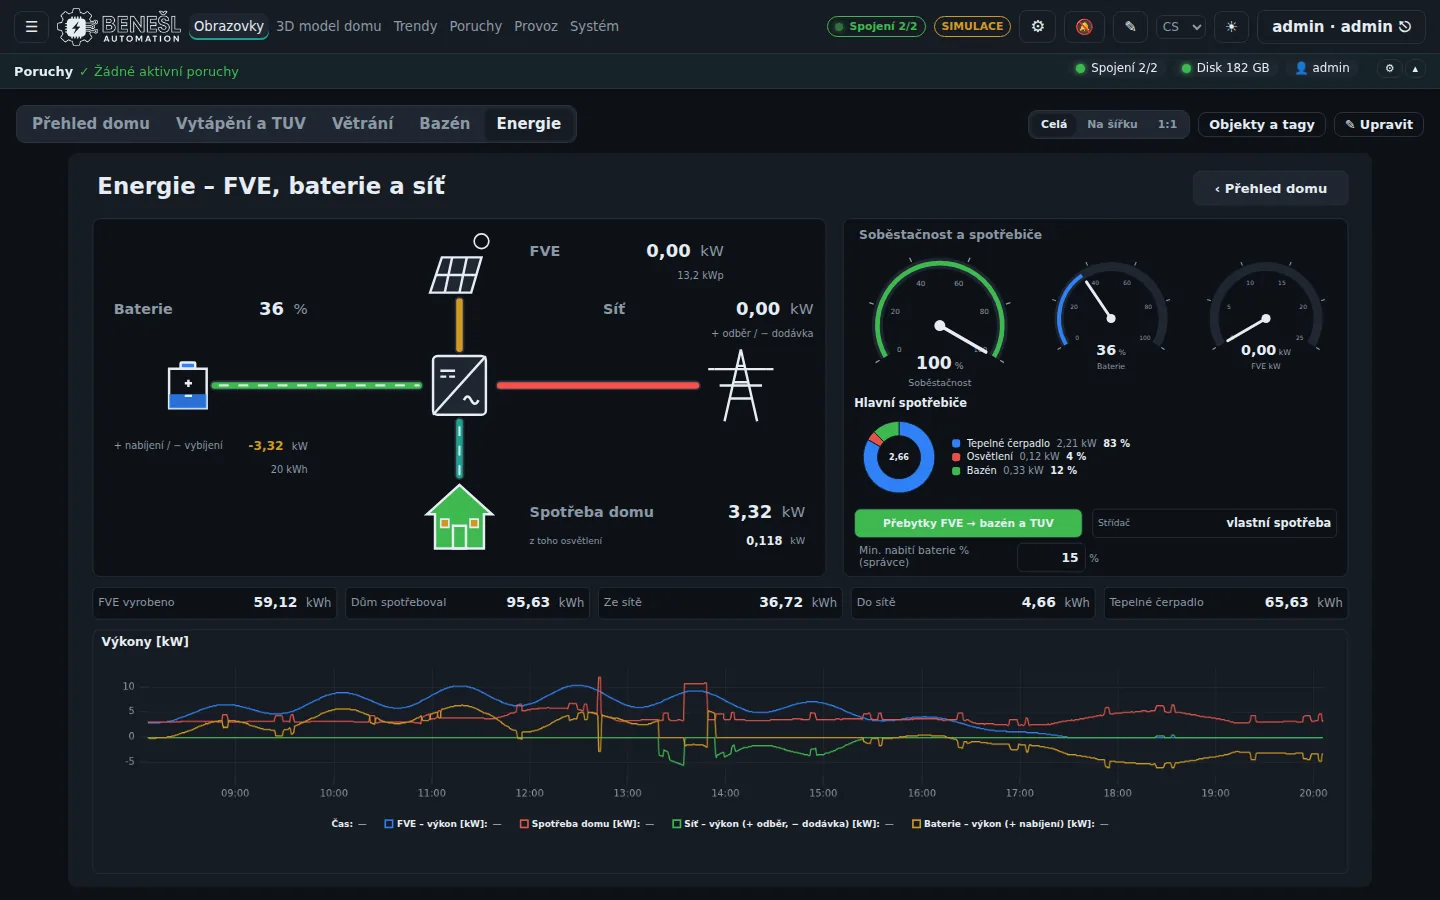
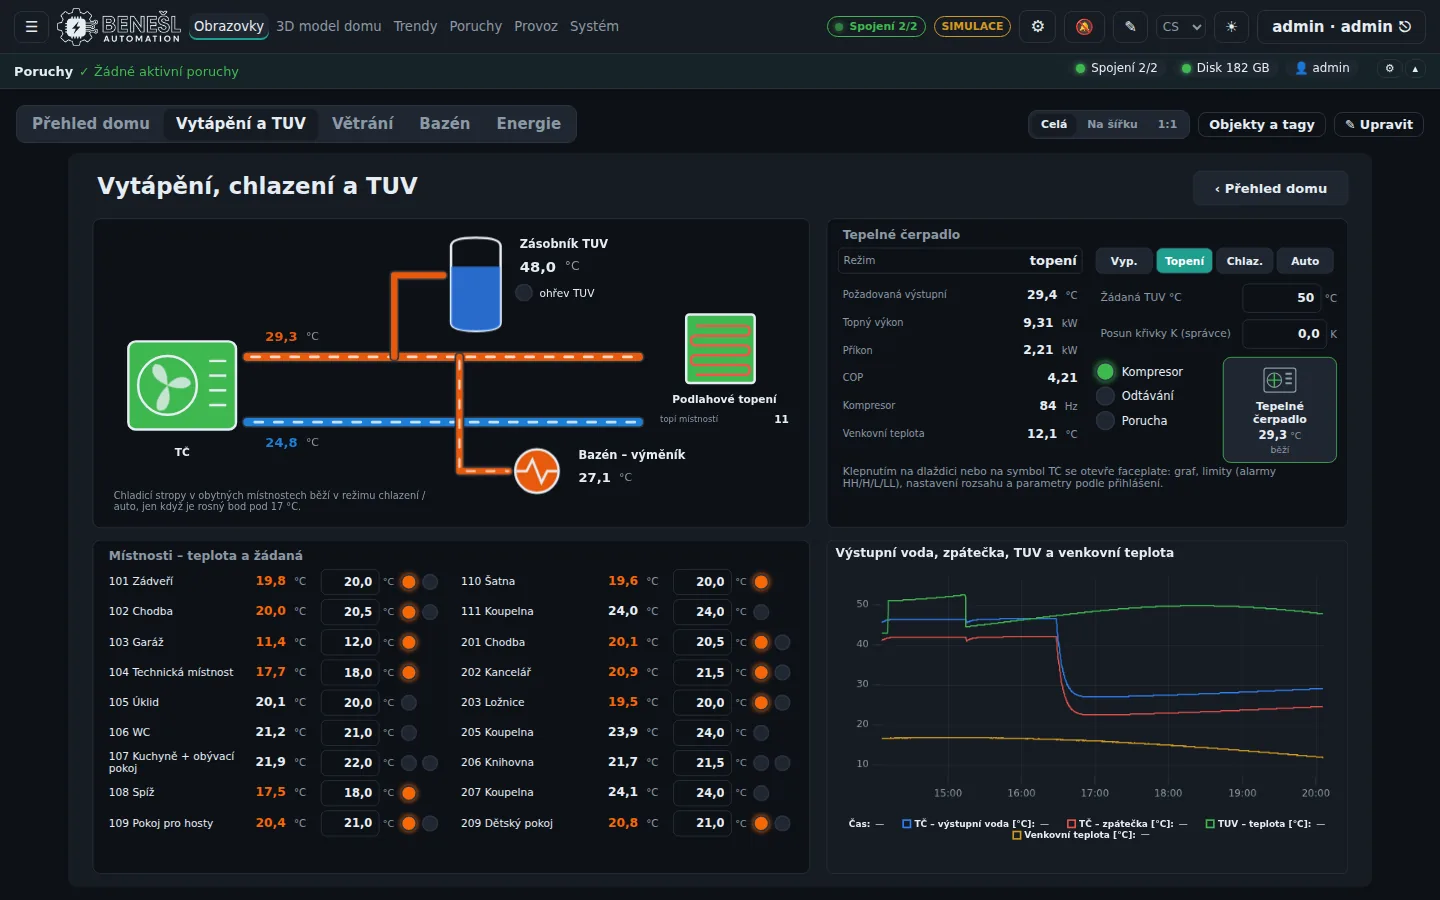
Open the smart home demo How the demo house is built Tip: log in in the demo panel, start the Evening scene and open the 3D house model – the living room, terrace and garden light up and the bedroom blinds close.
What the smart home in the demo can do
The demo is a complete BAVIS project running against a simulation of a family house with almost twenty rooms on two floors. Everything a real house needs can be operated from a browser on a computer, tablet or phone.
3D house model
A 3D model of the family house linked to live data: room temperatures, lights, blinds, PV production and battery state. Plus an overview of both floors with floor plans and room controls.
Lights and scenes
Dimming and colour temperature in every room, monitoring of luminaire faults and lighting power. House scenes such as Day, Evening, Night, Cinema or Party and the modes Home, Away and Holiday.
Blinds and pergola
Position and slat tilt of the blinds in each room, an automatic mode, a lock in strong wind and tilting of the pergola slats.
Heating and cooling
Heat pump, water heating, underfloor heating and cooling ceilings room by room with temperature setpoints. Cooling is blocked near the dew point, and open windows and low temperatures are monitored.
Heat recovery ventilation
Ventilation stage based on CO₂ in living rooms, air flow and filter state with a reminder to replace them according to maintenance.
Pool
An overflow pool of 6 × 3 m: filtration with a frequency-controlled pump and an automatic mode, heating, pH and redox measurement with automatic dosing of chlorine and pH−, filter backwash and water refill.
Energy and photovoltaics
A 13.2 kWp PV plant with a 20 kWh battery: flows between PV, battery, grid and house, self-sufficiency and the main consumers. The administrator sets the minimum battery charge.
Alarms and maintenance
Messages by room and by system: low temperature, high CO₂, an open gate or garage door, pH and redox out of range. Planned tasks such as the annual inspection of the battery and inverter or filter replacement.
Roles and safe operation
Operating the door and gate is confirmed with a prompt, administrator settings are kept separate and the server checks permissions on every action. The house connects to an S7-1500 PLC through a prepared data block.
Test chamber on the BAVIS core
The application for a test chamber for negative-pressure tests with gusts is built on the same core: test progress with state and time, live sensor values, records with charts, gust evaluation and the test report. The demo runs entirely in the browser on a recording of a simulated chamber.
The test in the demo is replayed from a recording of a simulated chamber. This is neither real measurement nor control, and all data (jobs, client, sample) is made up. The demo runs entirely in your browser and nothing is sent anywhere. After you close the tab, or after 60 minutes, everything returns to its default state.
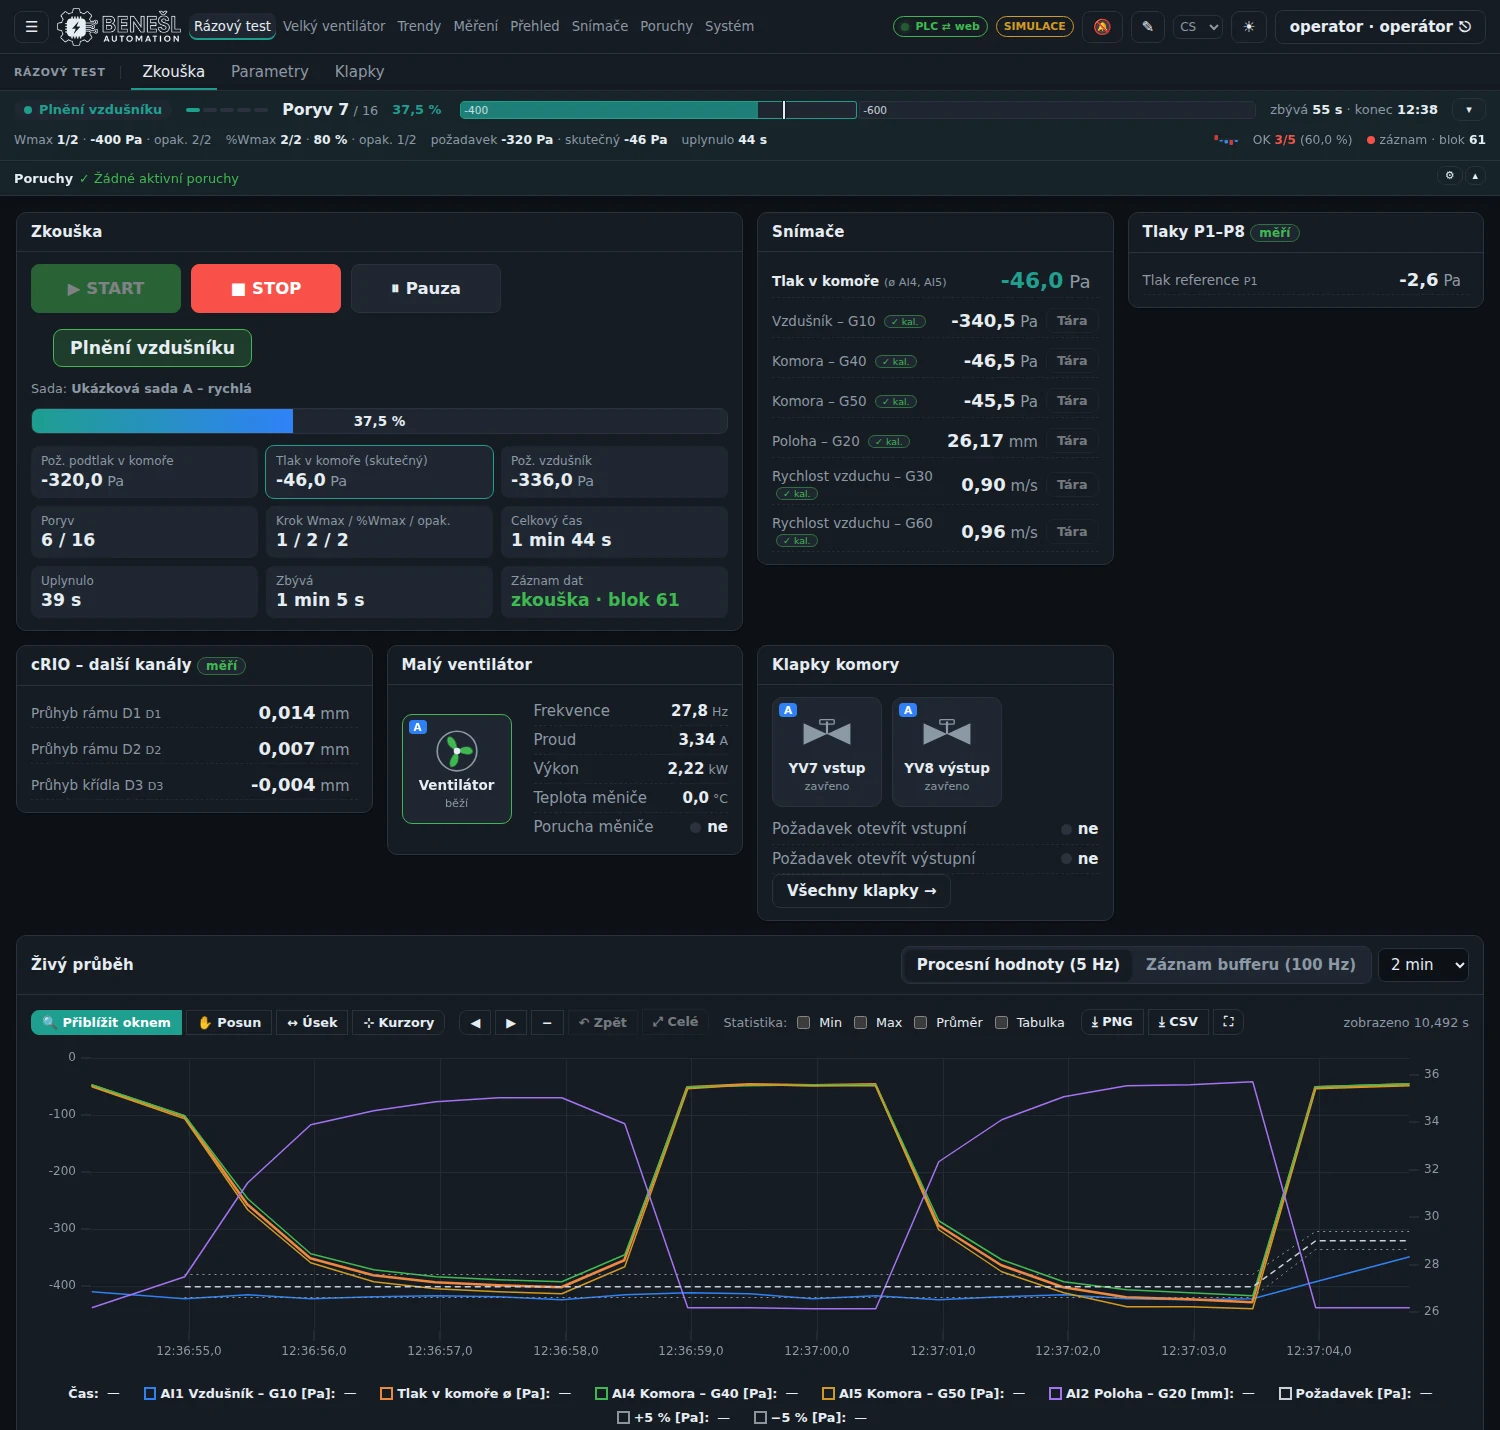
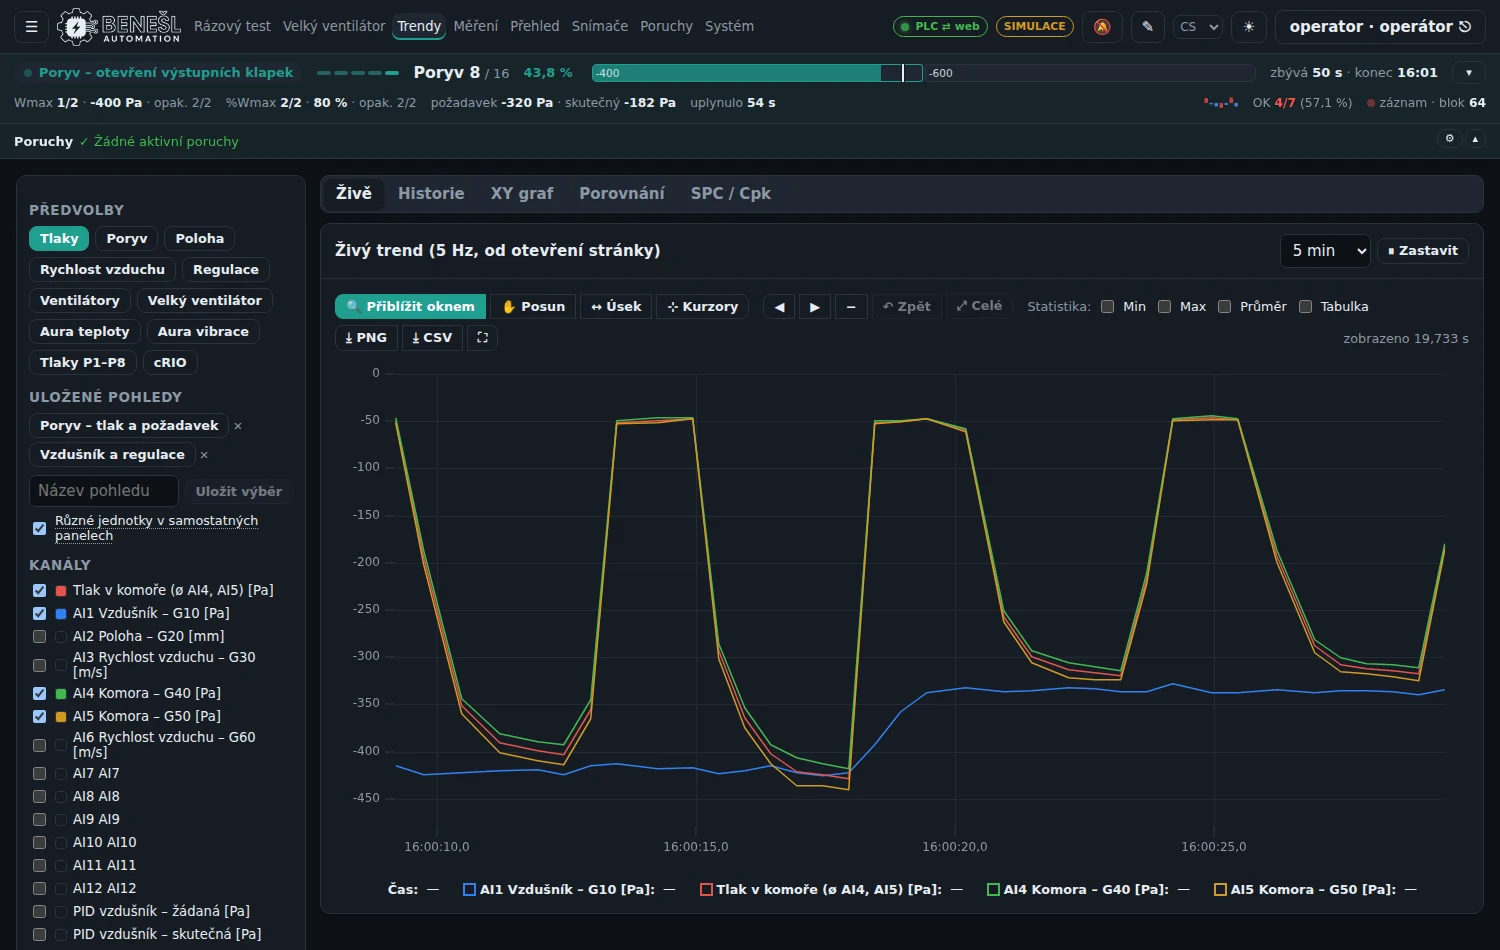
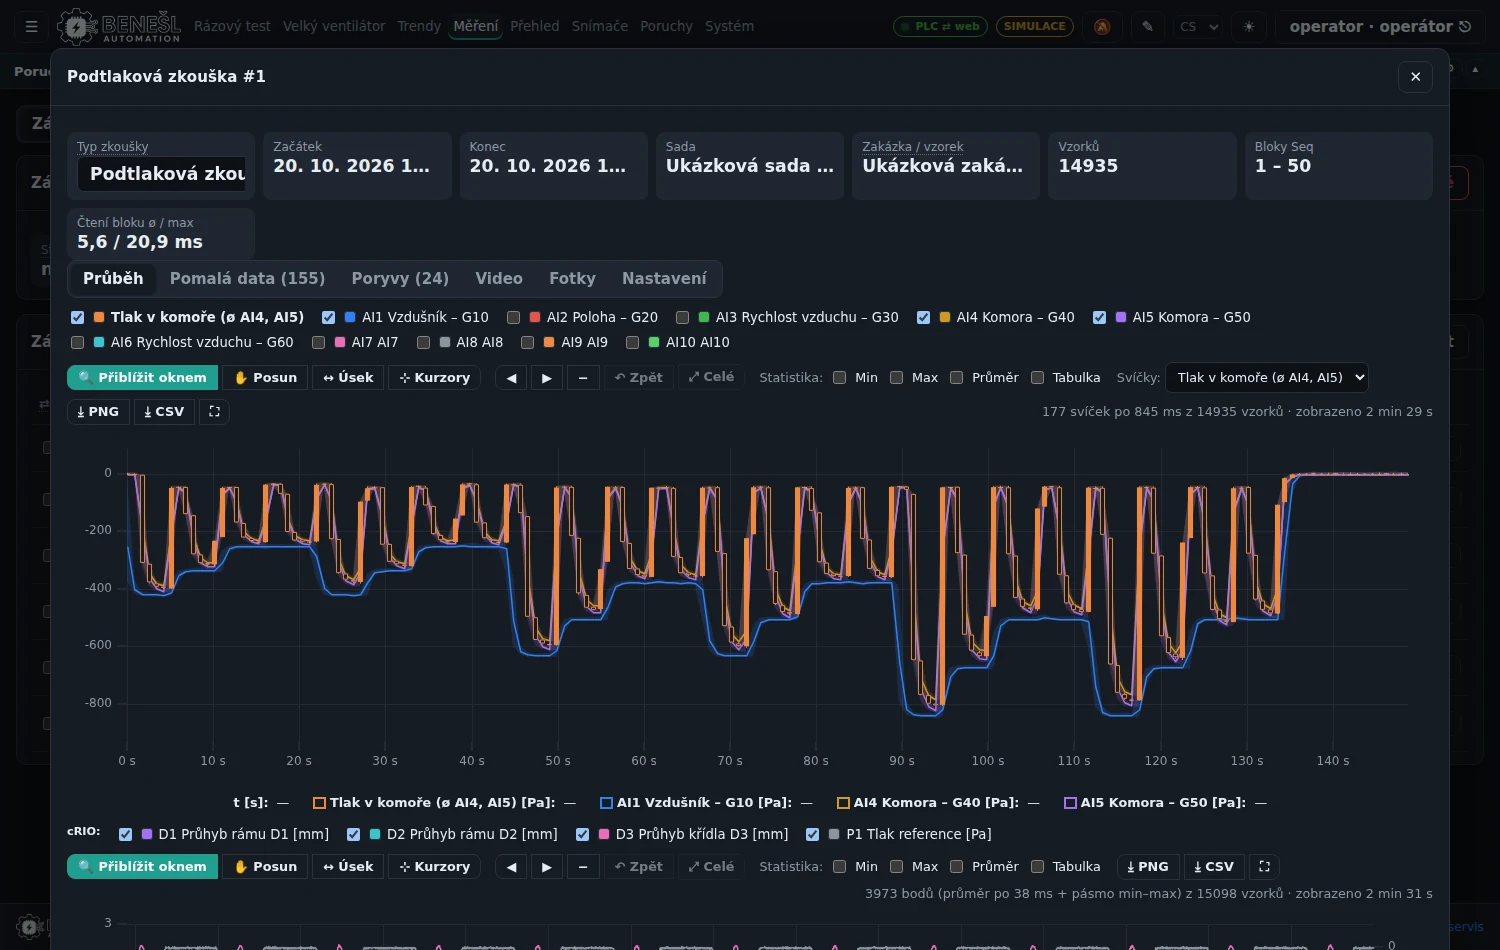
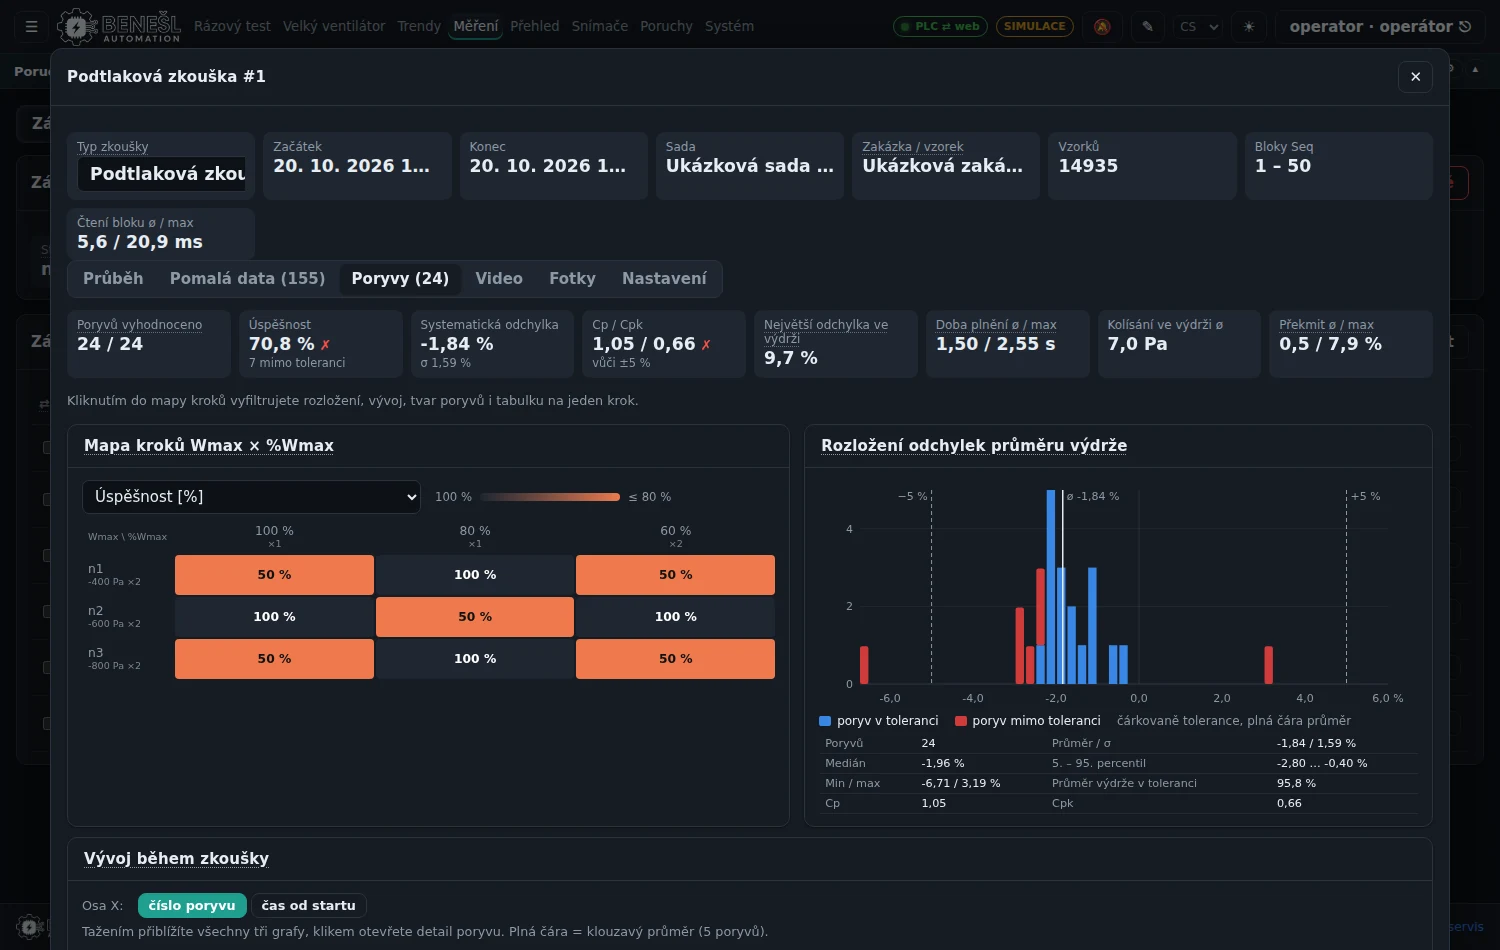
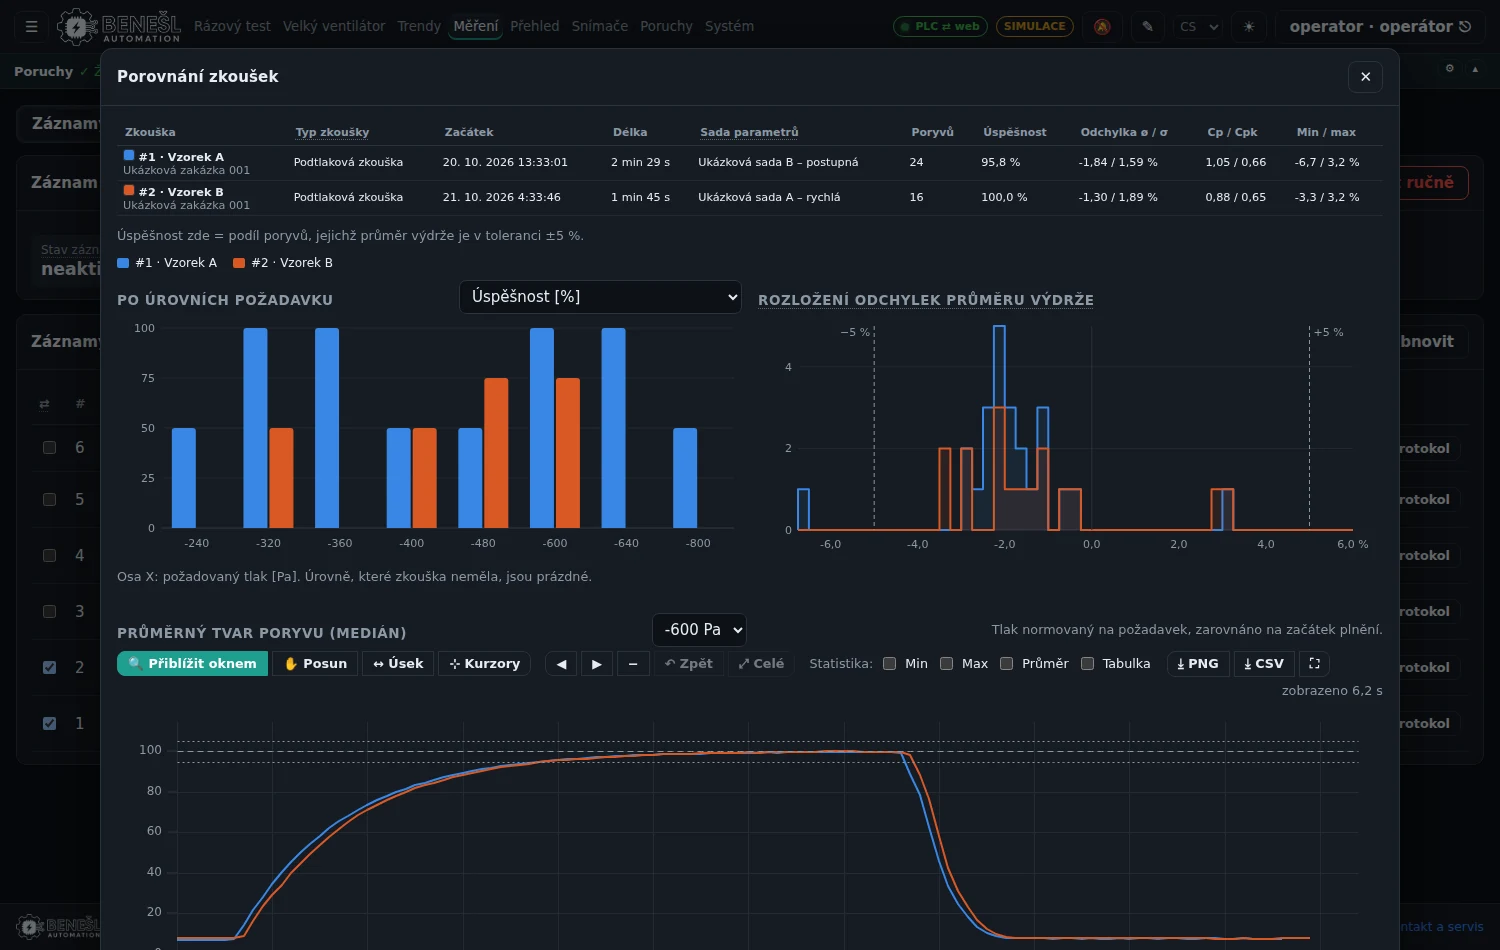
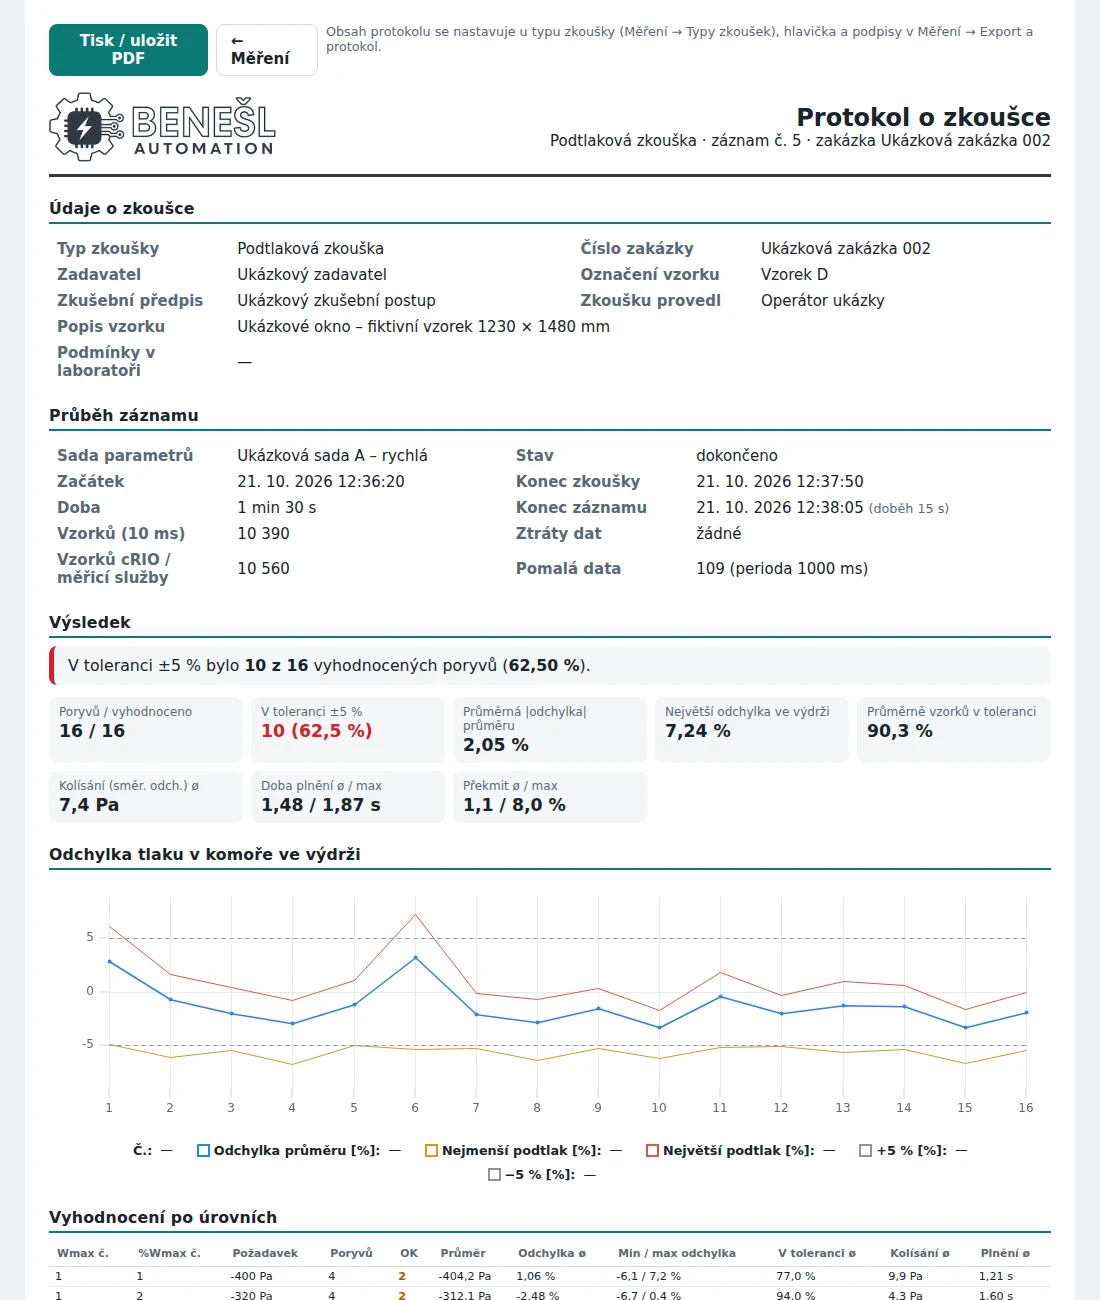
Open the test chamber demo Tip: log in in the demo panel at the bottom right, press START under Shock test → Test and follow the test. When it ends, a record with the gust evaluation appears under Measurements.
What the test chamber in the demo can do
The demo is the real BAVIS interface with the test chamber pages. From the course of a test through gust evaluation to the report, everything is in the browser.
Test progress
START, STOP and pause, test state, step, elapsed and remaining time, number of evaluated gusts and a live pressure chart. When the test ends, a new record with the report data is created.
Test and dampers
Live values of sensors (chamber pressure, air receiver, position, air velocity) and of measurement channels marked “measuring”, the fan and dampers. Outside a running test the dampers can be switched to manual mode and operated.
Parameters, sets and recipes
Test parameters, parameter sets and recipes. While a test is running, the parameters and manual damper control are locked.
Trends and SPC
Live trend, history, XY chart, comparison and control charts with the capability indices Cp and Cpk.
Test records
A list of records and a record detail with the chart of pressures over the whole test and a table of gusts.
Gust evaluation
Success rate within tolerance, deviation, Cp/Cpk, step map and deviation distribution. In the demo the evaluation is computed right in the browser.
Comparing tests
Comparison of two records: success rate per requested level, deviation distribution and the average gust shape.
Test report
A report with the test details, the result, the deviation chart and the evaluation per level. It can be printed or saved to PDF from the browser.
Overview, alarms and roles
Overview of test quality over time and alarms with history and statistics (a few simulated ones in the demo). Roles administrator, operator, viewer and maintenance; the interface is in Czech, English, German, Slovak and Polish.
Not in the demo: file downloads (CSV and XLSX export), cameras, system configuration and administration, licensing and updates. These buttons answer that they are not available in the demo.
What BAVIS looks like
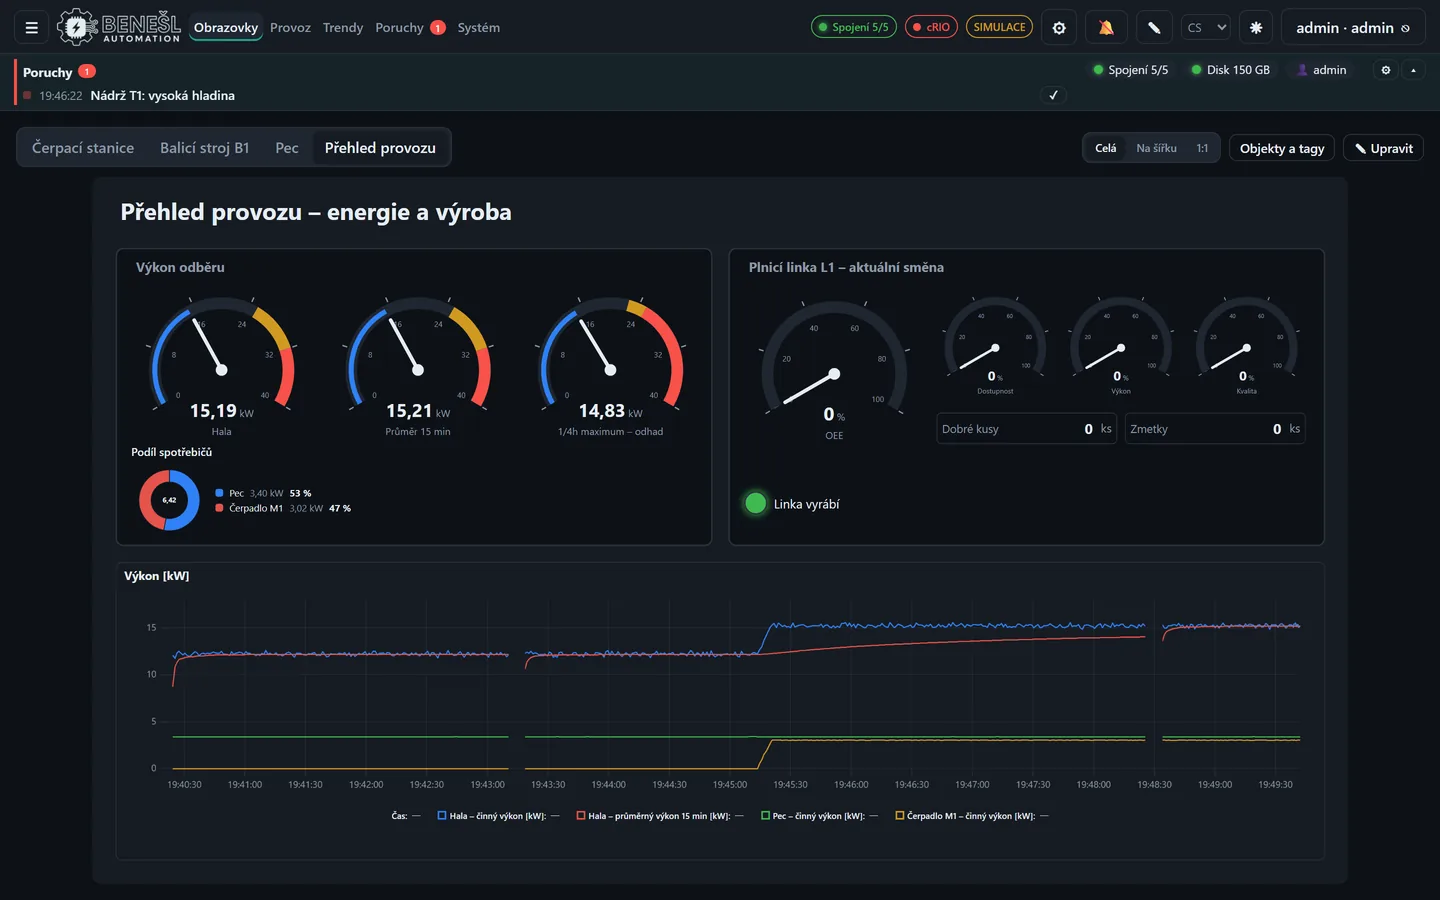
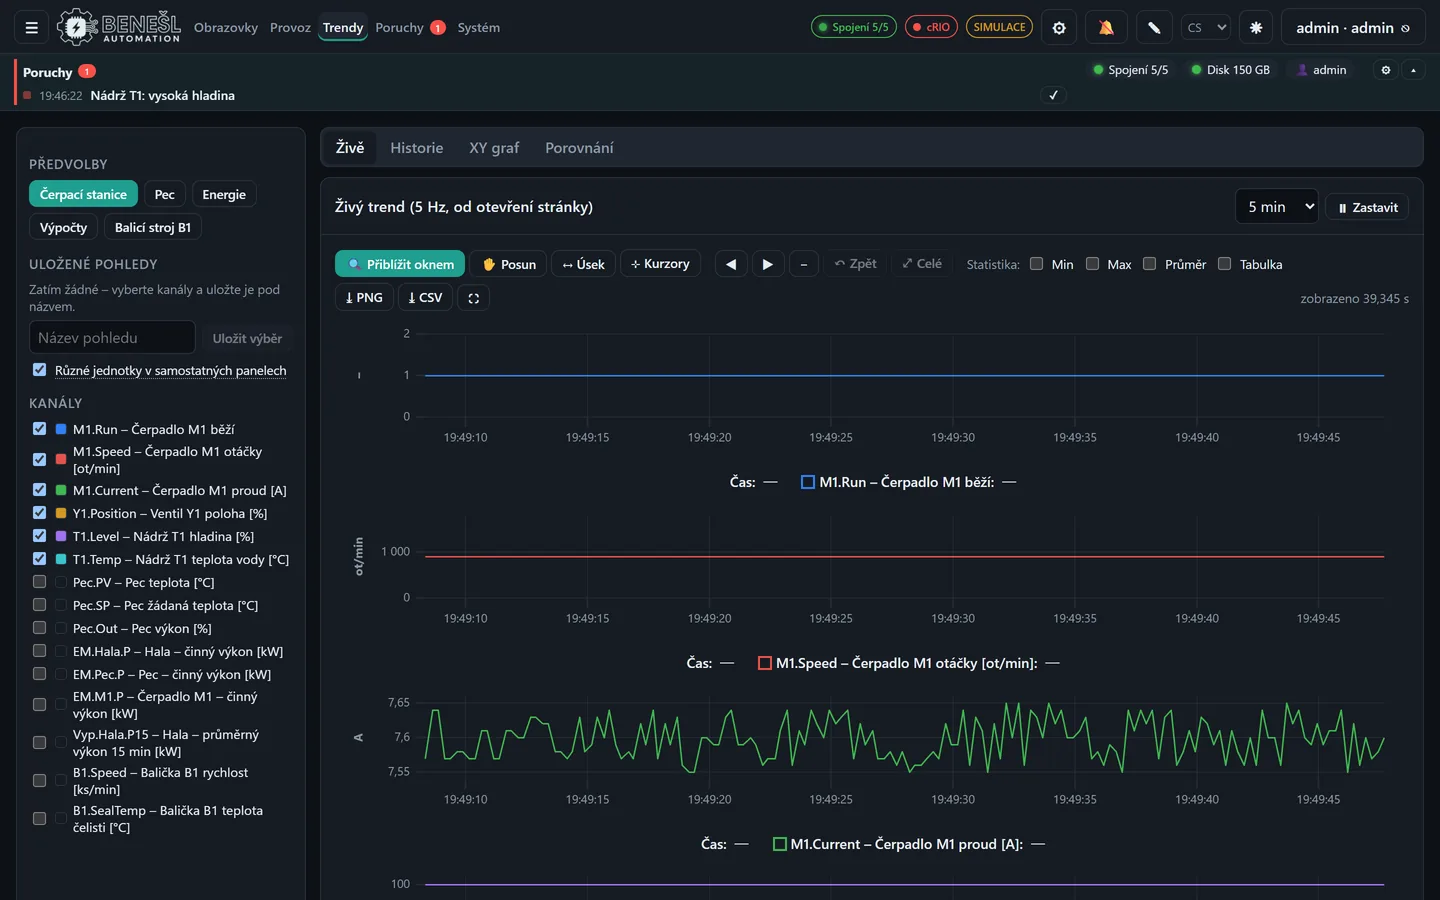
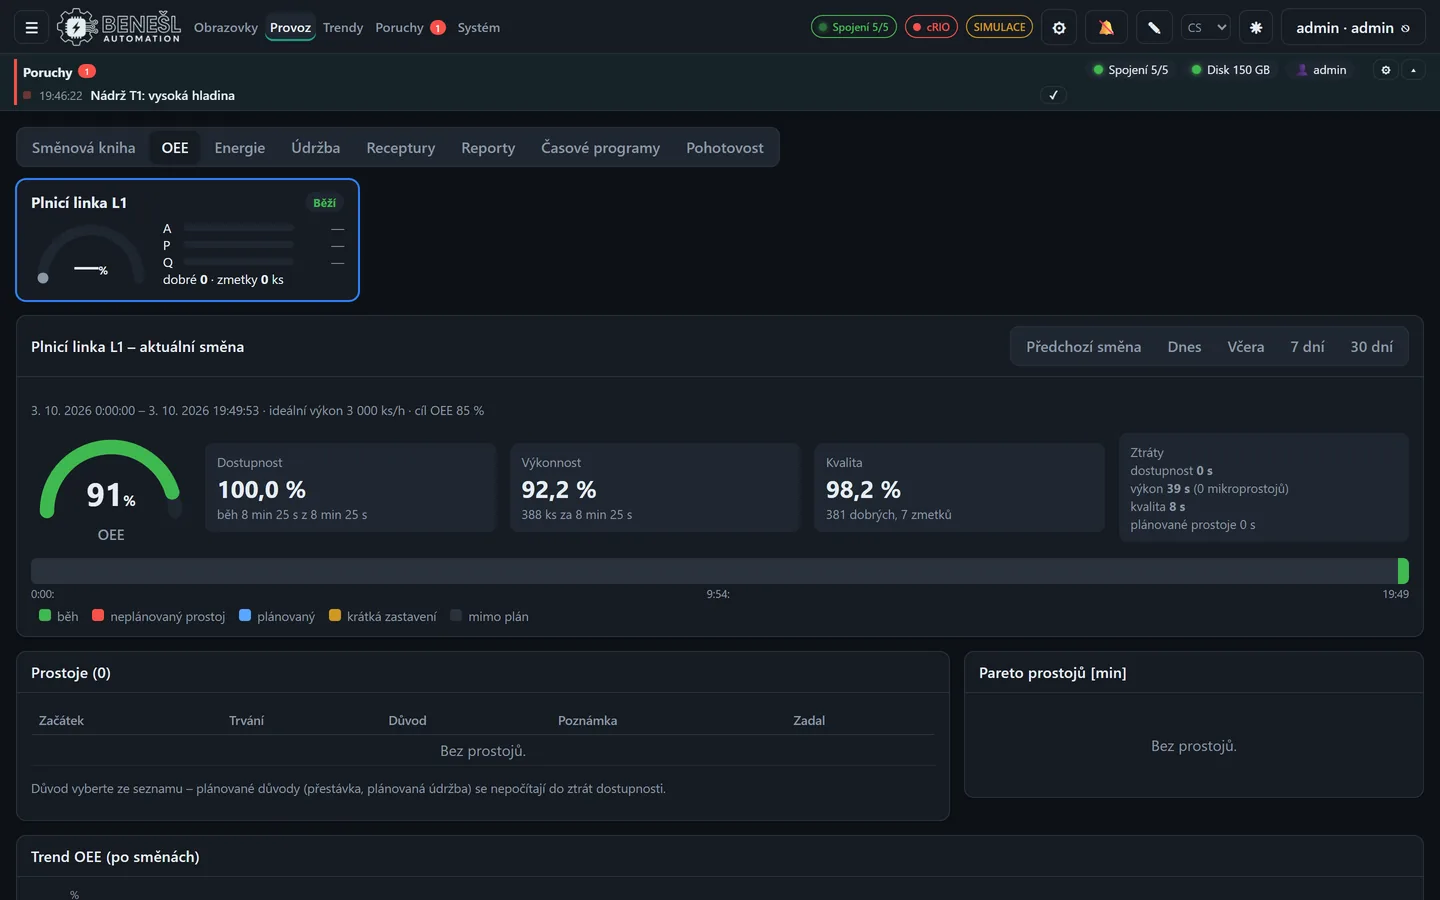
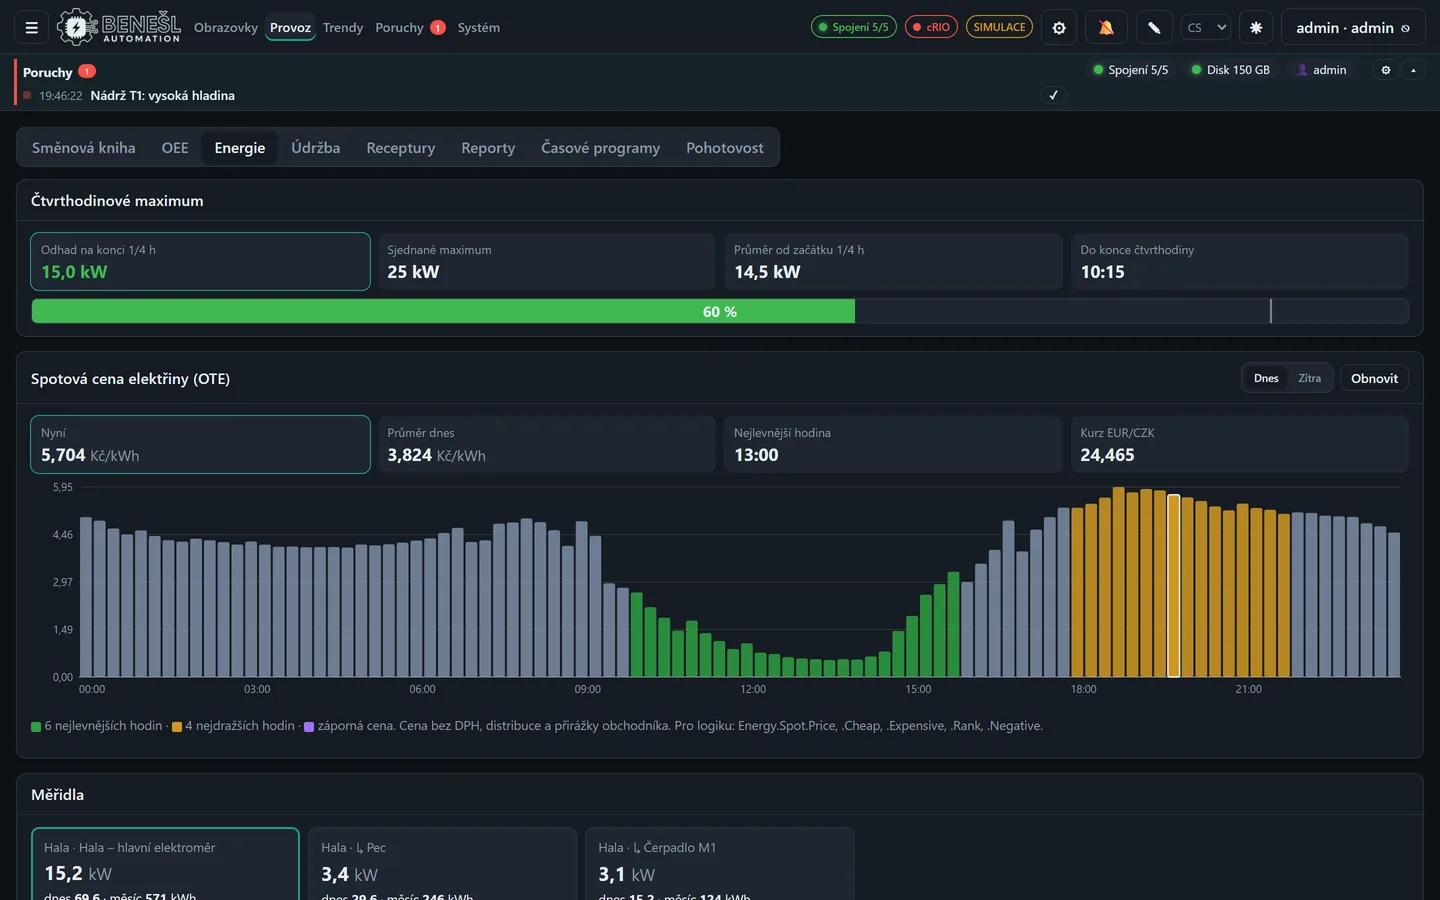
Screenshots of the real application in simulation mode with a sample project – a pumping station, a furnace and a packaging machine. The same screens run in the browser on a PC, tablet or phone.
What BAVIS 2.0 brings
Version 2.0 puts all our applications on one core. What we built for individual projects is now available to every project.
Page editing in the application
An administrator opens a page with the Edit page button to move, resize or delete its blocks, add new ones and place custom values, buttons and symbols. The administrator can try the edited version first, and one button restores the original.
Faster engineering
Detection of UDT and FB instances in PLC tags, alarm import from TIA Portal or Excel, templates for positioning drives, frequency converters and counters, 34 P&ID symbols and the ISA-101 style.
SPC and capability in trends
I-MR and X̄-R control charts, Cp, Cpk, Pp and Ppk indices and the Western Electric rules right on the trend data.
IT and cloud integration
Sparkplug B output over MQTT, data for Grafana and single sign-on via OIDC (Entra ID, Keycloak, ADFS).
Fast measurement and test video
Fast data acquisition at 100 Hz with resend after an outage, the NI-9237 measurement card and IP cameras. Video is stored without re-encoding and plays in sync with the chart in the record detail.
Safe updates
A signed package is uploaded in the browser and the previous version stays ready for rollback. If the new version crashes repeatedly right after start, the previous one comes back automatically. Open browsers offer to load the new version.
What the application can do
Process control like a classic SCADA, plus what is hard to do in one: custom data evaluation, OEE, energy, maintenance, reports and access from anywhere on the company network. The interface is available in Czech, English, German, Slovak and Polish.
Diagrams and screen editor
Overview diagrams with P&ID symbols, animated piping and dynamics, equipment faceplates and IP cameras. We draw the screens and you can edit them in the editor right in the browser, including mobile versions.
Recipes and batches
Recipes locked while the process runs and compared with current values, sequence control, a time-stamped record of every batch or test.
Connects to everything
Siemens S7, Modbus TCP, OPC UA, MQTT, Beckhoff ADS and EtherNet/IP. Tag import from TIA Portal, OPC UA and Modbus server for higher-level systems. Since version 2.4 also M-Bus, wM-Bus, BACnet/IP, KNX IP, Modbus RTU and a built-in MQTT broker.
Trends and analysis
Live and historical trends with panels per unit, a value cursor, XY charts, period comparison and statistics. Data compression and aggregation, so even years of history load instantly.
OEE, shifts and downtime
Live line OEE, a running/stopped timeline, downtime Pareto and downtime classification by operators. A shift log with shift handover and an alarm summary.
Energy and spot prices
Electricity meters and tariffs, 15-minute peak monitoring, day-ahead spot prices with the cheapest hours recommended, CO₂ and EnPI indicators per ISO 50001.
Maintenance and work orders
Operating hours and starts from the PLC, maintenance intervals, a work order from an alarm in one click, a spare-parts store and QR labels on equipment for mobile use.
Alarms per ISA-18.2
Groups, suppression, first-out, shelving with a reason and flood statistics. Notifications by e-mail, SMS, Telegram and push to phones, on-call rota with escalation.
Evaluation and reports
Tolerance and capability checks, PDF reports, scheduled reports even into the customer's own XLSX template, FAT and SAT protocols with electronic signatures.
Automation without programming
Calculated tags, if → then logic, weekly time schedules with public holidays. Data to MES and the cloud via MQTT, HTTP, SQL or InfluxDB, buffered during outages.
Reliable and secure operation
Redundancy with two servers, connection monitoring, security designed with IEC 62443 in mind (two-factor authentication, LDAP, plant areas, SIEM), andon and a central multi-site overview.
Always-on bar
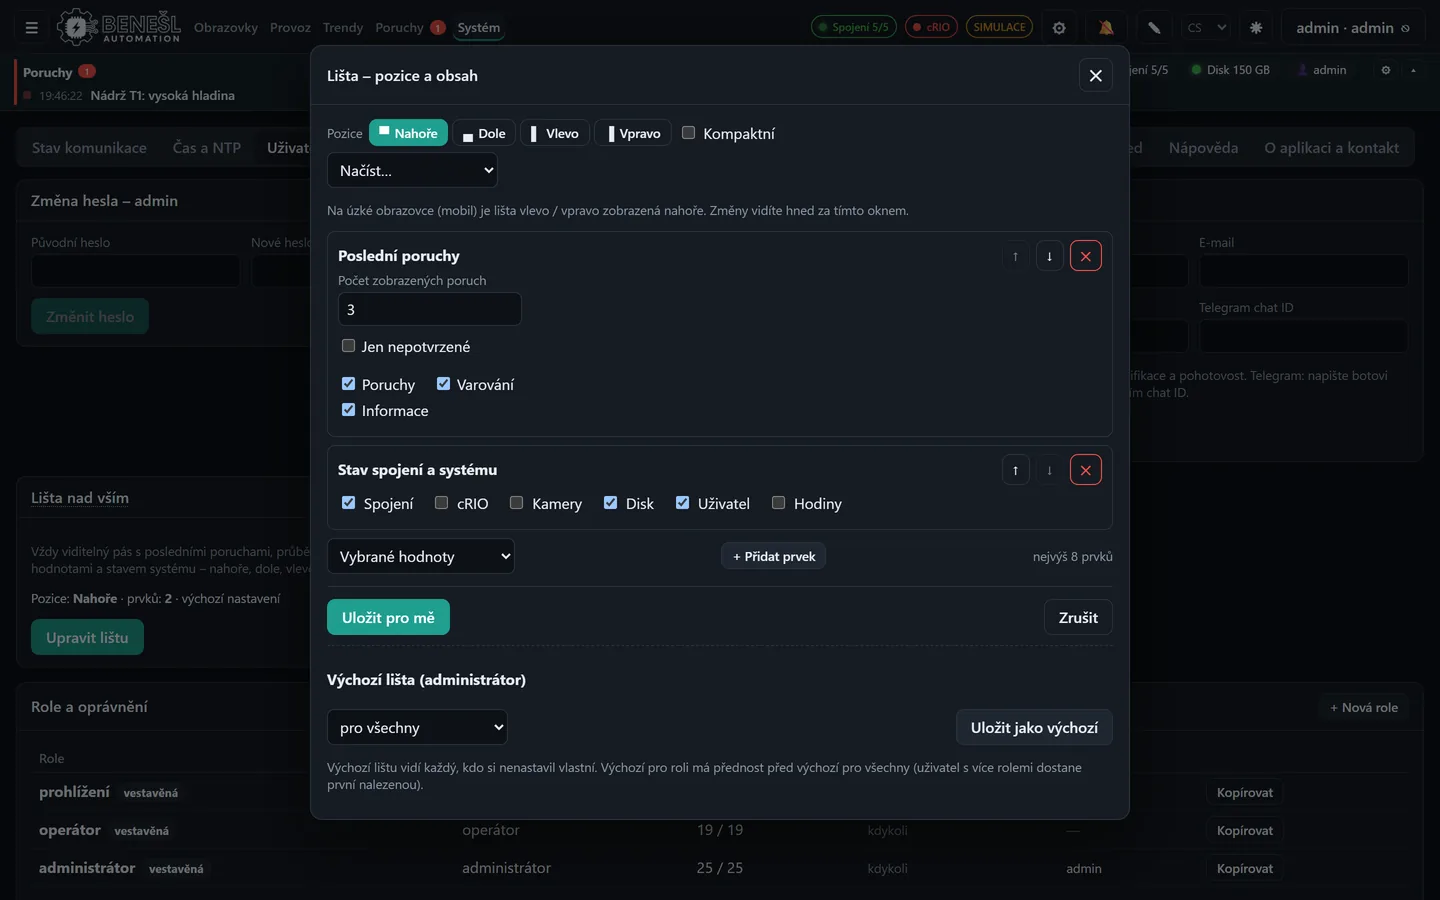
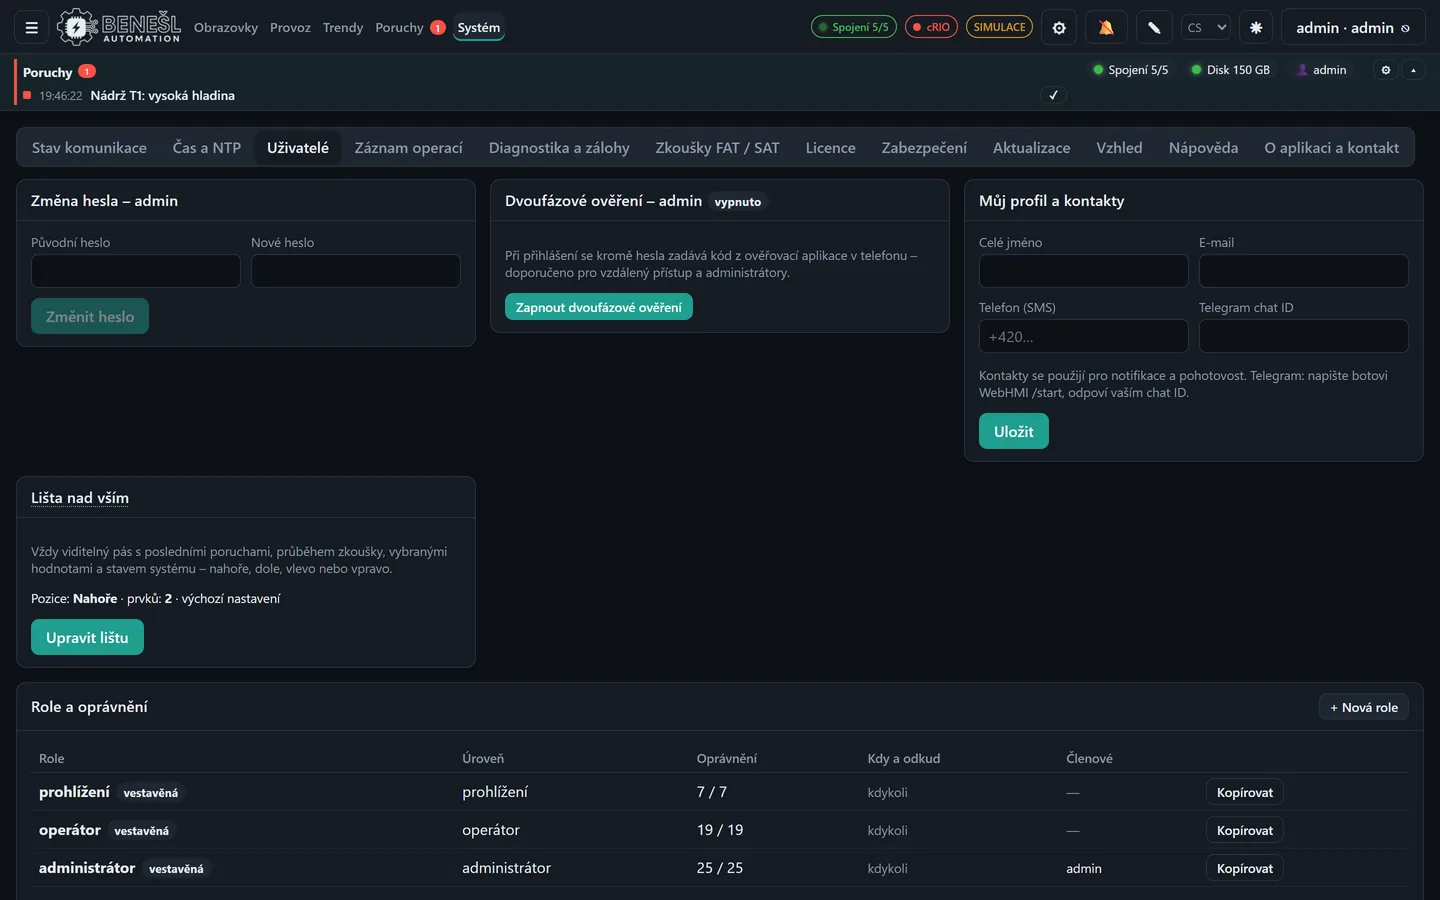
A strip visible on every page: latest alarms with one-tap acknowledgement, connection and disk status, selected values with limits. Top, bottom or side – the administrator sets the default and everyone can adjust it.
Custom roles and permissions
Roles built from a catalogue of permissions, control only during a shift or from specific computers and networks, conditions based on equipment state. The server checks every action.
Core and projects
Communication, alarms, trends, users and data logging live in the shared core. A project for a specific plant adds screens, evaluation and reports. The core is updated separately and the project stays unchanged.
Simulation mode
Virtual commissioning: tags are simulated with ramps, lags and delays, so screens, alarms and reports are debugged before the PLC is even connected.
Licence and modules
The licence is bound to the computer running the application server; browser clients are free. The base covers visualisation and data acquisition, further functions are added as modules according to what the plant really needs.
The Lite (up to 150 tags) and Maker (up to 5,000 tags) editions are free for non-commercial use. For commercial operation the Standard edition is tiered by tag count, from CZK 3,900 excl. VAT for a perpetual licence. Further protocols and functions are licensed separately or in bundles.
Included in the base
- Diagrams, control and screen editor
- Data acquisition, history and trends
- Alarms, users and operation log
- PLC communication and simulation mode
Optional modules
Prices for editions, protocols and bundles are in the editions overview. Integration and commissioning are prepared to measure – priced by complexity.
Editions and prices BAVIS licence agreement Versions and support
Need a similar application?
Tell us what your process needs. We will design a solution tailored to your PLC, data and operators, whether it is replacing an existing visualisation, data acquisition or production evaluation.